Fig. 4.
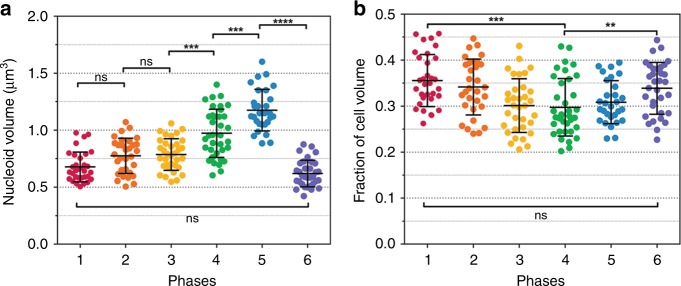
Nucleoid compaction as a function of D. radiodurans cell cycle. a Changes in nucleoid volume as cells progress through their cell cycle. Nucleoid volumes were retrieved from the three-dimensional signal of Syto9-labelled nucleoids of live, exponentially growing D. radiodurans cells. The nucleoid volume is relatively constant during the first three phases ( ~ 0.7 μm3) and then progressively increases to reach a maximal volume of ~ 1.2 μm3 in Phase 5 cells just before cytokinesis. b The fraction of the cell volume occupied by the nucleoid was retrieved by dividing the nucleoid volume of individual cells by their matched cell volume, derived from spinning-disk images of dual-labelled Syto9- and Nile Red-stained cells, using the cell measurements presented in Supplementary Fig. 2. The fraction of the cell occupied by the nucleoid significantly decreases during the first three phases (from 0.35 to 0.30), and then remains around 0.30 until cytokinesis. After septal closure, the fraction increases again to 0.34. a, b Data are represented as mean ± SD (N = 195, N > 29 for each phase). Individual values are shown as dots. (*P < 0.05, **P < 0.01, ***P < 0.001, ****P < 0.0001, ns: not significant, statistical test: non-parametric Mann–Whitney). Source data are provided as a Source Data file

