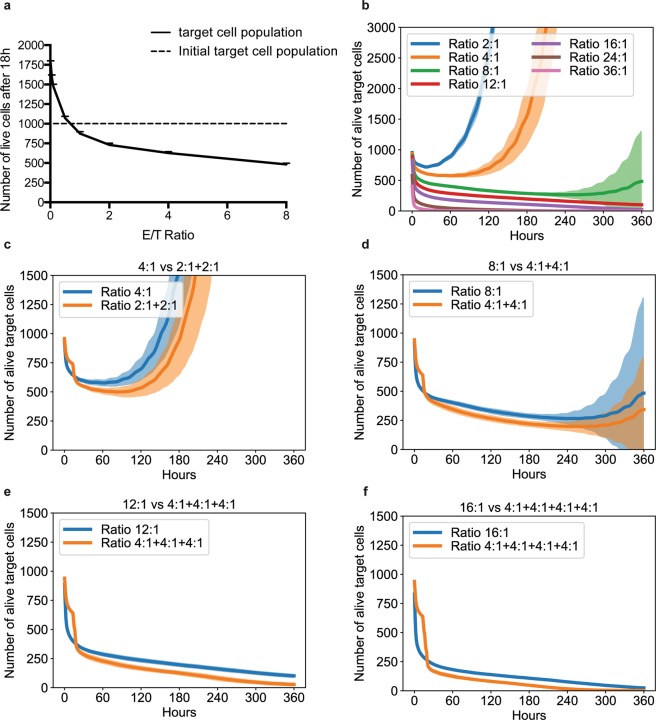
Figure 4.
Prolonged time simulations show an intrinsic weakness of CTL in controlling tumor growth that can be overcome by sequential addition of fresh CTL cohorts. Panel (a) shows the number of target cells alive after 18 hour simulated co-culture at different E/T ratios. Panel (b) shows the limited control of tumor growth during 15 days of simulated co-culture. Panels (c–f) show the benefit of multiple additions of fresh CTL cohorts to the simulated culture. Results correspond to mean +/− SD of 20 independent runs. Statistical comparison of data shown in panels (c–f) was performed using Wilcoxon test and is presented in Supplementary Table 2.

