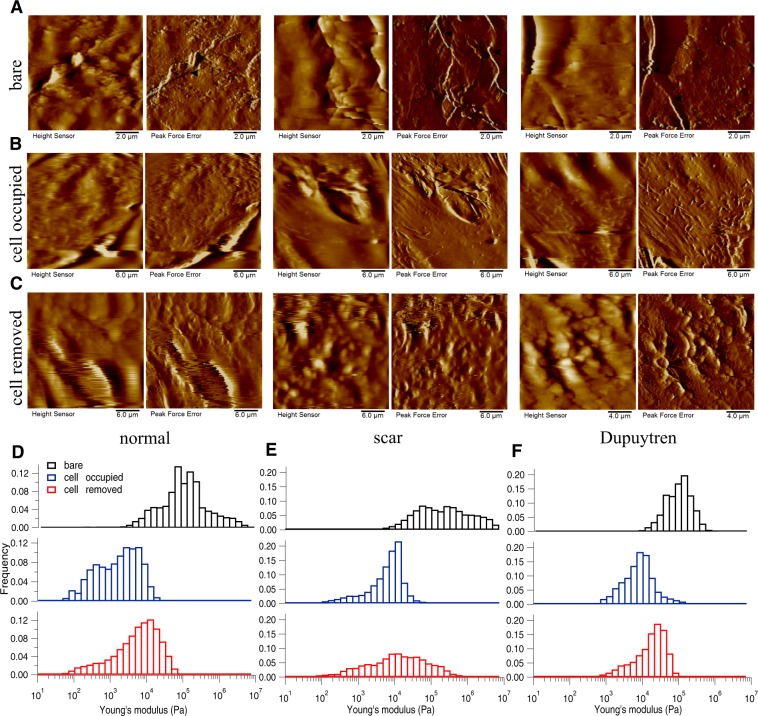
Figure 4.
Changes in decellularized matrix topography and mechanics assessed in DED. (A) Height and PeakForce error images of bare matrix show the presence of irregular structures of ECM components in the bare matrix. (B) After cell culture for two weeks, height and PeakForce error images show the matrix with normal, scar or Dupuytren’s fibroblasts. (C) After removing the cells, height and PeakForce error images show the matrix topography. Histograms of Young’s modulus values of bare (black bar), cell-occupied (blue bar), and cell-removed DED matrix (red bar), for normal (D), scar (E) and Dupuytren’s fibroblasts (F). The shifts in the histograms show the change in DED matrix mechanics by all three fibroblast types. The respective medians of Young’s modulus values are shown in Supplementary Fig. 2B. Filled and open arrow heads indicates the thick and thin fibres, respectively.

