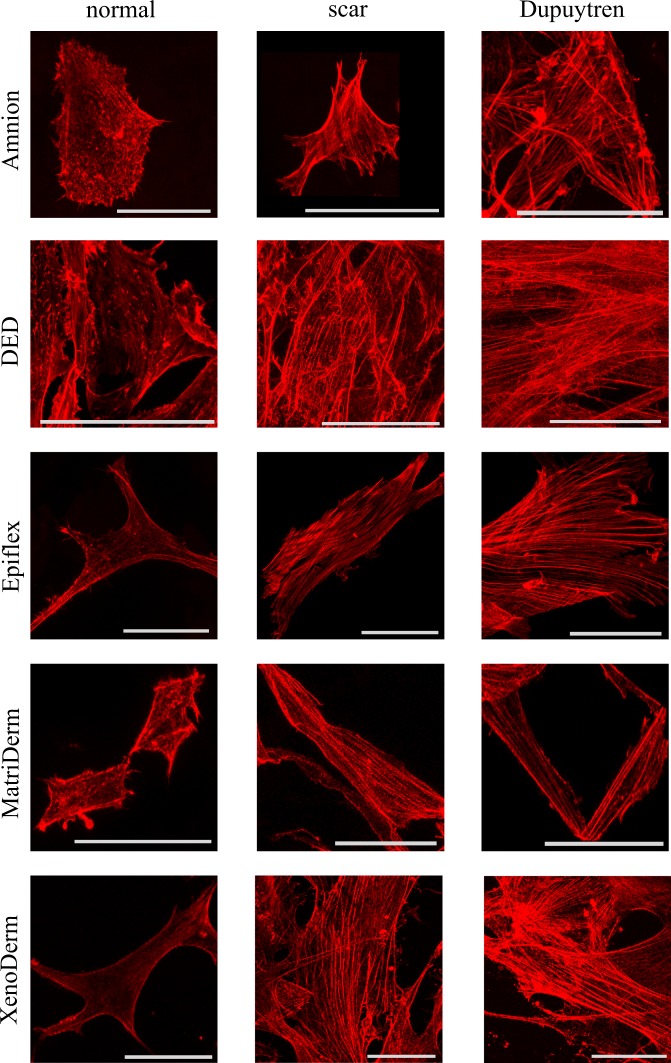
Figure 8.
Confocal images of normal, scar and Dupuytren fibroblasts seeded on different matrices. Fibroblast stress fibre formation in decellularized matrices is assessed by rhodamine phalloidin actin fluorescent staining. Fluorescence images show the presence of thick stress fibres in pathological fibroblasts (scar and Dupuytren’s) that results in higher values of cell mechanics compared to normal fibroblasts that express less or no stress fibres on all decellularized matrices and therefore impress as softer. Scale bar are 50 μm.

