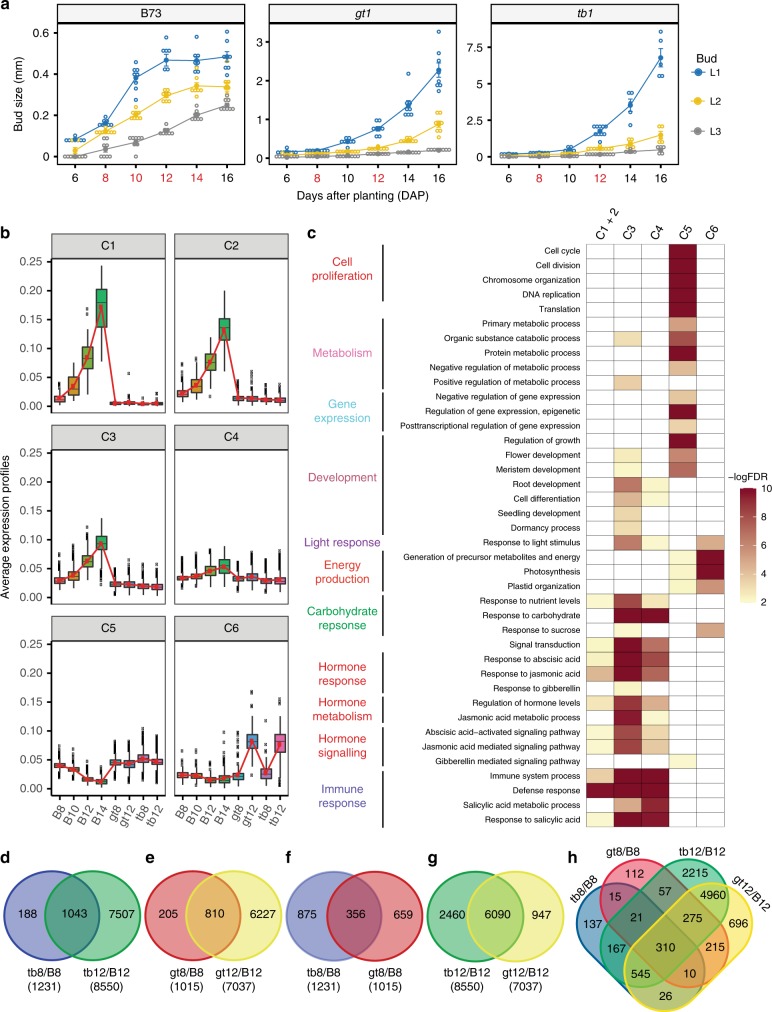
Fig. 1.
Transcriptional profiling of bud dormancy regulated by gt1 and tb1. a Length of tiller buds in the first (L1), second (L2), and third (L3) leaf axis of B73, gt1 and tb1 at 6, 8, 10, 12, 14, and 16 days after planting (DAP). Buds from development stages in red on the x-axis were collected for RNA-seq transcriptome profiling. Bars for each stage represent the mean ± standard error of eight replicates. b Six co-expression clusters (C1–C6) were identified from the 6998 genes that were differentially expressed across the B73 developmental series, gt1 and tb1. Clusters have been sorted such that those with similar mean vectors (as measured by the Euclidean distance) are plotted next to one another. Connected red lines correspond to the mean expression profiles for each cluster. The vertical bars define the upper or lower quartile, and dots outside the bars indicate outliers. c Over-represented GO terms in the co-expression clusters identified in b. Go terms with false discovery rate (FDR) ≤ 0.01 (−logFDR ≥ 2) were considered as significantly enriched. d–h Venn diagrams showing common or uniquely differentially expressed genes between early (pre-dormancy at 8 DAP) and late (post-dormancy at 12 DAP) stage in tb1 and gt1 compared to B73. B8, B10, B12, and B14 represent B73 tiller buds at 8, 10, 12, and 14 DAP, respectively; similarly tb8, tb12, gt8, and gt12 stand for tb1 and gt1 tiller buds at 8 and 12 DAP, respectively

