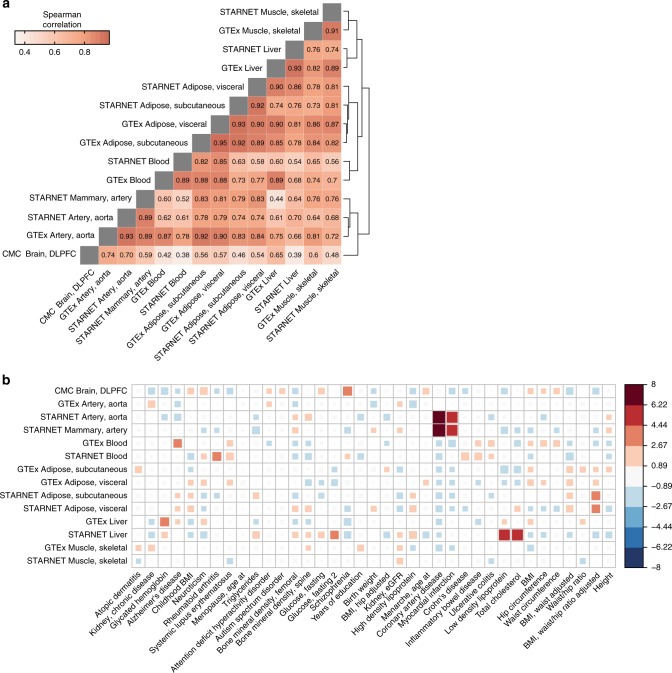
Fig. 3.
Contribution of GWAS and tissues to gene-trait associations. a Correlation of genetically regulated expression imputed for different tissues (pooled GTAs for all traits). Correlation is calculated for significant imputed expression changes with the Spearman method. Dendrogram on the right edge is shown from Ward hierarchical clustering. b Enrichment of tissue-specificity of significant EpiXcan GTAs compared to a null model, where each tissue contributes equally (Pearson’s χ2 test p value = 2.7 × 10⁻⁸). Statistically, the enrichment is the Pearson standardized residual for each tissue-trait pair from the χ2 test. Box size and color indicate enrichment (red) or depletion (blue) for each tissue-trait pair. Only traits with expected frequency of more than 1 significant gene-trait association for each tissue model are evaluated as per Pearson’s χ2 test requirements. Tissues and traits are ordered based on Ward hierarchical clustering. Right-hand side panel indicates tissue-specificity enrichment score

