Fig. 3.
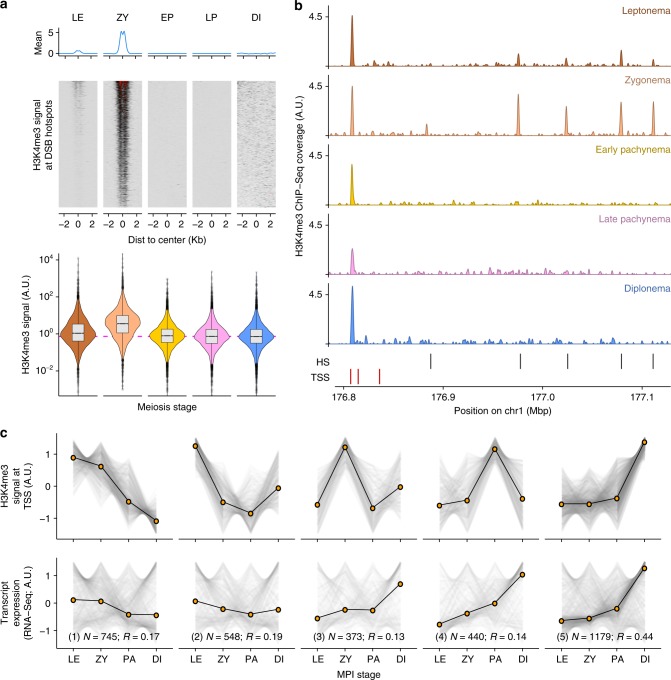
H3K4me3 dynamics across meiotic substages. a H3K4me3 dynamics at DSB hotspots across five meiotic substages. H3K4me3 signals at DSB hotspots are normalized by the spike-in H4K4me3 mononucleosomes. Quantified H3K4me3 signal is shown in violin plot (lower panel). b H3K4me3 dynamics at different genomic elements in five sorted subpopulations of meiotic nuclei. HS hotspots, TSS transcription start sites. c Stage-specific H3K4me3 at TSSs recapitulate meiotic gene expression patterns. Genes with only one isoform are selected for this analysis. H3K4me3 profiles at TSSs are grouped into five clusters (top), while the respective mRNA levels are shown in the bottom panel. LE Leptonema, ZY Zygonema, PA Early and Late Pachynema, DI Diplonema. The number of transcripts per cluster (N) and Spearman correlation coefficient (R) for all transcripts are shown. Source data are provided as a Source Data file

