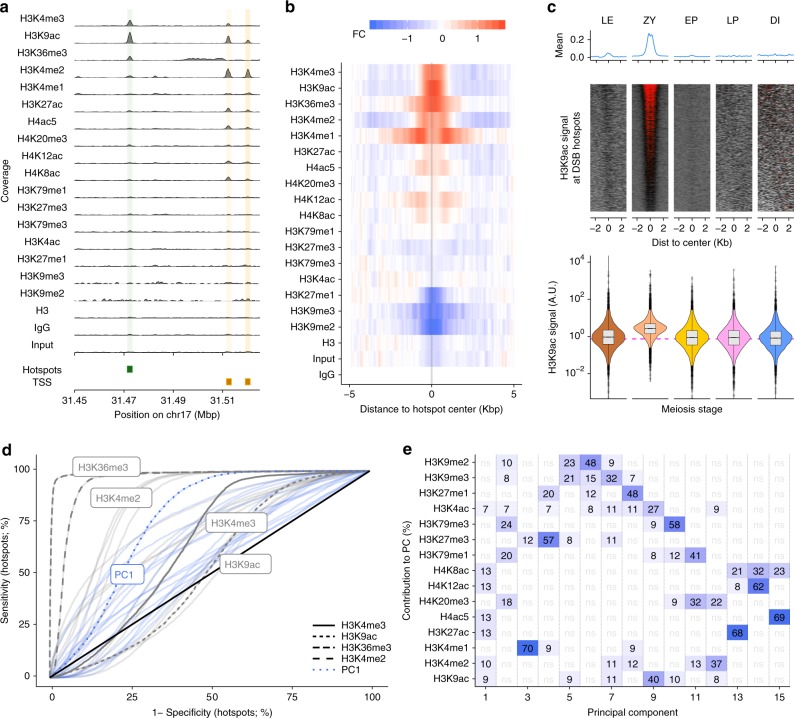
Fig. 4.
Histone modifications at DSB hotspots. a Distributions of histone marks along a genomic region. Locations of DSB hotspots are shaded in green, TSS (transcription start sites) in orange. b Histone marks are enriched at DSB hotspots. Red depicts enrichment relative to IgG, blue is depletion. c H3K9ac dynamics at DSB hotspots across five meiotic substages. Quantified H3K9ac signal is shown in violin plot (lower panel). d, e Principal component analysis using histone marks can distinguish DSB hotspots from PRDM9-independent H3K4me3 sites. d Histone modifications can distinguish DSB hotspots from other H3K4me3 sites. An ROC curve for each histone mark (gray) or PC (blue) is shown. Selected histone modifications and PC1 are highlighted. e Contributions of histone marks to each PC. Only marks that contribute more than expected are shown. Deeper blue indicates a stronger contribution (numbers show percent contribution). Data shown in this figure (except c) are ChIP-Seq data collected from an early MPI population (leptonema to early pachynema; SCP3+ and H1t− population). Source data are provided as a Source Data file. DSB double-strand break, TSS transcription start sites

