Fig. 8.
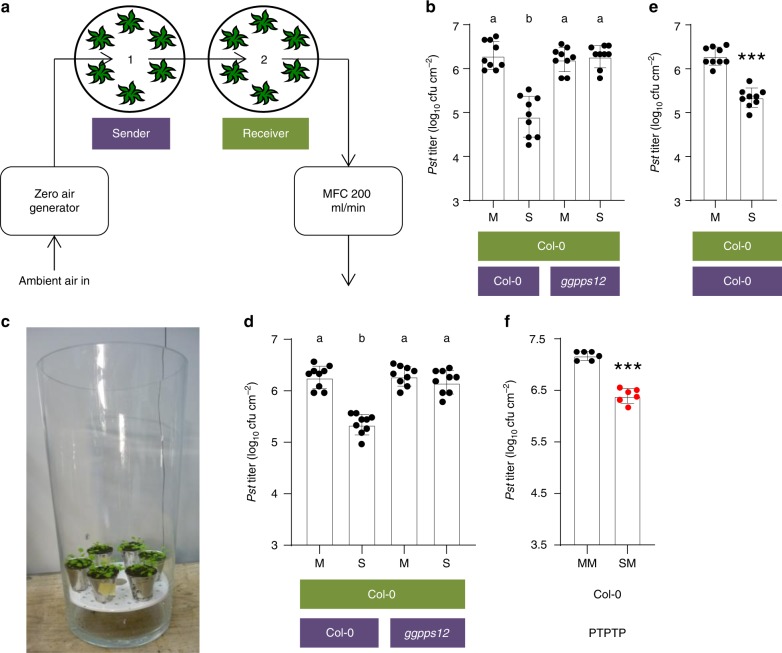
PTP propagation of innate immunity in open systems. a Experimental setup of PTP experiments under dynamic/flow-through conditions. Sender and receiver plants were incubated in separate, but via 1/8″ tubes connected vacuum desiccators. VOC-free air was derived from ambient air by a zero-air generator and pulled through the system at a flow rate of 200 mL min−1. (b–e) PTP experiments in the dynamic system (b), open glass vases (c, d), and open desiccators (e). Receivers were exposed to the emissions of Pst/AvrRpm1-infected (SAR-induced; S) or mock-treated (M) sender plants in the different experimental setups (e.g., a, c). The plant genotypes are indicated below the panels (senders in purple and receivers in green); the treatment of the senders is indicated below the bars. After 3 days, receivers were inoculated with Pst, and the resulting in planta Pst titers at 4 dpi are shown. Dots indicate individual results from three biologically independent experiments, including three replicates each. Bars represent the average of the indicated results ± standard deviation. Different letters above bars indicate significant differences, one-way ANOVA, P < 0.05. f PTPTP experiment in Col-0 wt plants. Data summarize Pst titers in receiver 2 plants. Receiver 1 had been exposed to SAR-induced (S) or mock-treated (M) sender 1 plants in the flow-through system from (a) for 3 days. Subsequently, receiver 2 was exposed to mock-treated receiver 1 plants in the same setup. After another 3 days, receiver 2 plants were inoculated with Pst, and the resulting in planta Pst titers at 4 dpi are shown. Dots indicate individual results from two biologically independent experiments, including three replicates each. Bars represent the average of the indicated results ± standard deviation. Asterisks above bar indicate a significant difference from the mock control (t test, P < 0.001). MFC, mass flow controller

