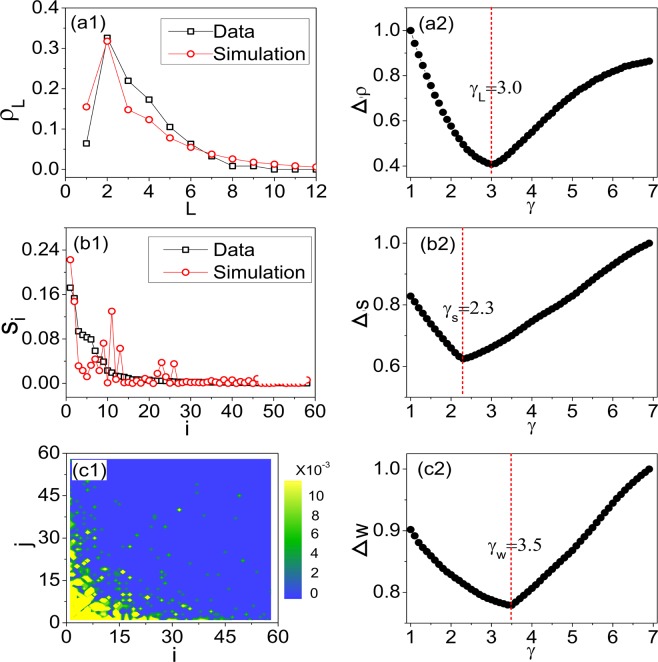
Figure 8.
The estimation of parameter γ. (a1) The probability distribution of the travel length. Black squares: surveyed results. Red circles: numerical results obtained at γL. (a2) The variation of the normalized difference of travel length, , with respect to γ. is minimized at . (b1) The distribution of city visitation volumes, {si}. Black squares: surveyed results. Red circles: numerical results obtained at γs. (b2) The variation of the normalized difference of city volume, Δs, with respect to γ. Δs is minimized at about . (c1) The distribution of the tourist flows, {wij} obtained from surveys. (c2) The variation of the normalized difference of tourist flows, Δw, with respect to γ. Δw is minimized at . The parameter γ used in Eq. (1) is defined as the average of the three optimal parameters, .

