Figure 6.
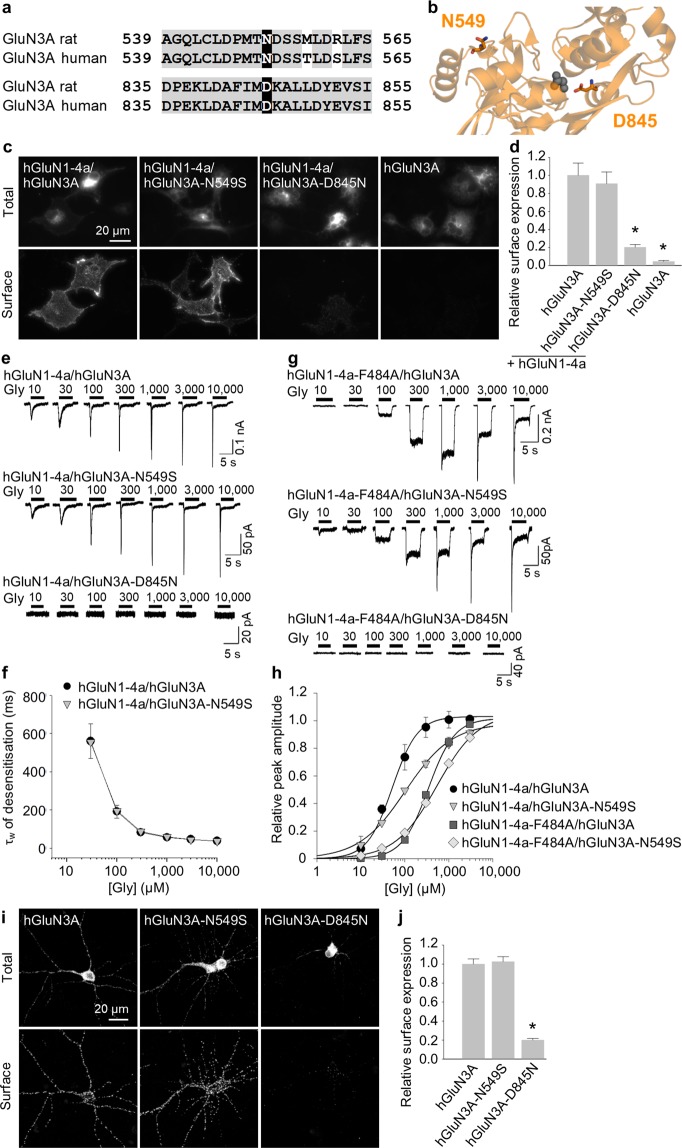
Clinically relevant mutation in the LBD of the GluN3A subunit alters the surface delivery of NMDARs. (a) Sequence alignment of the rat and human GluN3A subunits, with two clinically relevant mutations in the LBD shown in black rectangles. The numbers refer to the amino acid residues. (b) Schematic representation of the part of the LBD of the GluN3A subunit (PDB code: 2RC7); the amino acid residues studied here, and a glycine molecule, are shown. (c) Representative images of COS-7 cells transfected with the indicated human GFP-GluN3A (hGluN3A) and GluN1-4a (hGluN1-4a) subunits. (d) Summary of the relative surface expression of the indicated hGluN1-4a/hGluN3A subunits measured using fluorescence microscopy (n ≥ 18 cells per group); *p < 0.05 vs. hGluN1-4a/hGluN3A (ANOVA). (e,g) Examples of whole-cell patch-clamp recordings from HEK293 cells transfected with the indicated hGluN1-4a/hGluN3A receptors. Currents were elicited by applying the indicated concentration of glycine. (f) Summary of the τw of desensitisation for the indicated hGluN1-4a/hGluN3A receptors (n ≥ 5 cells per group). (h) Peak concentration-response curves for the indicated wild-type and mutant hGluN1-4a/hGluN3A receptors. Each data point represents the mean relative currents recorded from ≥4 cells. The EC50 values and Hill coefficients are listed in Table 2. (i) Representative images of hippocampal neurones transfected at DIV10 with wild-type or mutant hGluN3A subunits and labelled at DIV14. (j) Summary of the relative surface expression of the indicated subunits measured in 10-µm segments of secondary or tertiary dendrites (n ≥ 50 segments from ≥10 different cells per group); *p < 0.05 vs. hGluN3A (ANOVA).

