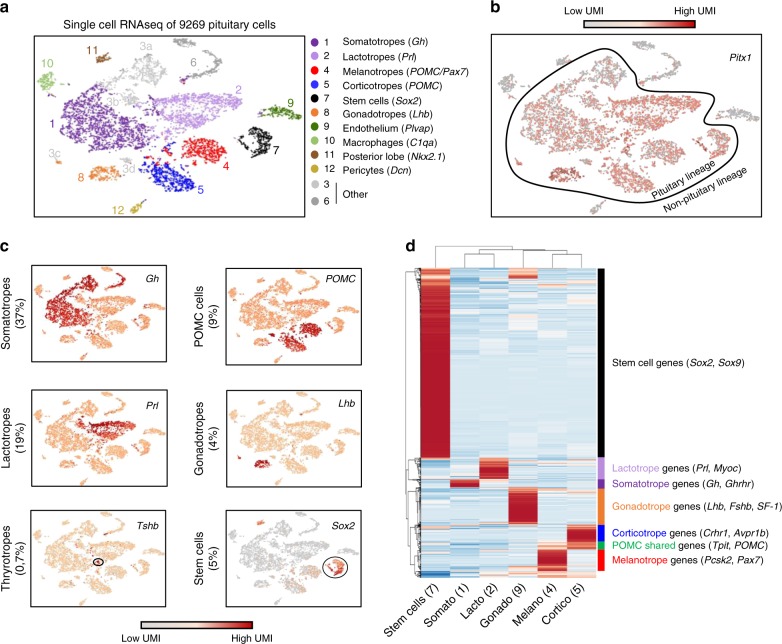
Fig. 1.
Transcriptional complexity of the pituitary adult gland. a t-Distributed stochastic neighbor embedding (t-SNE) map (t-distributed stochastic neighbor embedding) plot of the 9269 profiled pituitary cells colored by the 12 clusters identified using unsupervised k-means clustering. Cluster identification included expression of the hallmarks gene(s) indicated between parenthesis and the markers shown in c. b t-SNE map showing color-coded Pitx1 expression. c t-SNE map showing color-coded expression of indicated markers for the major pituitary lineages. d Heatmap showing normalized expression of the 1000 most differentially expressed genes (p value <0.05, fold change (FC) >2 and minimum number of unique molecular identifier (UMI) >0.3) in clusters representing the different endocrine and progenitor cells (clusters 1, 2, 4, 5, 7, and 8). Rows are centered; unit variance scaling is applied to rows. Both rows and columns are clustered using correlation distance and average linkage

