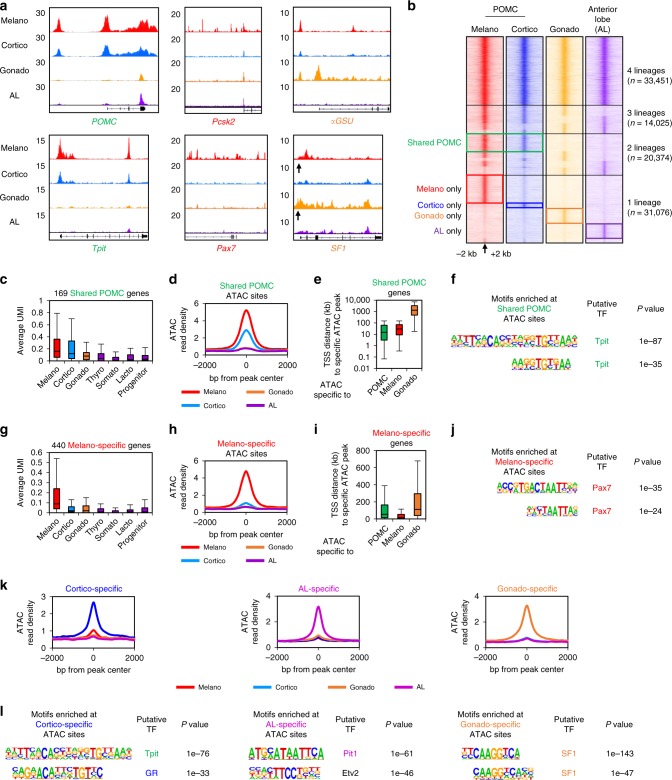
Fig. 2.
Lineage-specific chromatin access reveals lineage regulators. a Genome browser view (Integrative Genomics Viewer (IGV)) of assay for transposase-accessible chromatin using sequencing (ATACseq) profiles at genes marking pituitary lineages: Shared pro-opiomelanocortin (POMC) markers (green), melanotrope (red), or gonadotrope (orange). The SF1 promoter is indicated by an arrow. b Heatmaps showing ATACseq signals (reads per kilobase of transcript, per million mapped reads (RPKM)) across the different pituitary lineages in a 4 kb window around the ATACseq peak center indicated by an arrow. Colored boxes indicate peaks specifically enriched in the indicated lineage. c Box-plot showing expression (unique molecular identifier (UMI)) of gene markers of the POMC lineages across the different lineages. Center lines show medians; box limits indicate the 25th and 75th percentiles; whiskers extend to 1.5 times the interquartile range from the 25th to 75th percentiles. d Average profiles of ATACseq signals at POMC-specific ATACseq peaks. e Box-plot of distances between the TSS of POMC-specific genes and the closest ATACseq peak in POMC, melanotropes and gonadotrope cells. Box-plot features as in c. f Motif enriched (assessed by HOMER) under POMC-specific ATACseq peaks and not found in other subsets. g Box-plot showing expression (UMI) of melanotrope gene markers across the different lineages. Box-plot features as in c. h Average profiles of ATACseq signals at melanotrope-specific ATACseq peaks. i Box-plot of distances between the transcription start site (TSS) of melanotrope-specific genes and the closest ATACseq peak in POMC, melanotrope, and gonadotrope cells. Box-plot features as in c. j Motif enriched (assessed by HOMER) under melanotrope-specific ATACseq peaks and not found in other subsets. k Average profiles of ATACseq signals at cortico-, gonado-, and AL-specific ATACseq peaks. l Motifs enrichment (assessed by HOMER) under cortico-, gonado-, and AL-specific ATACseq peaks and not found in other subsets

