Fig. 5.
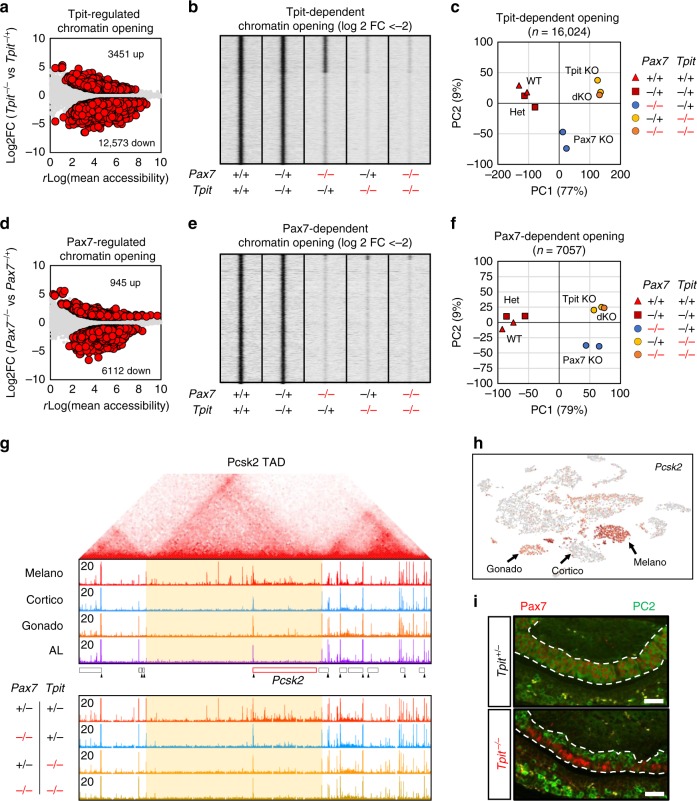
Pax7-dependent chromatin landscape requires Tpit. a Dispersion plot showing average assay for transposase-accessible chromatin using sequencing (ATACseq) rlog values (assessed by Deseq2) over the log 2 fold changes (FCs) of Tpit heterozygote versus Tpit knockout IL at all accessible regions. Differentially accessible regions (p value <0.05 and log 2 FC >±1 as computed by Deseq2) are shown as red circles. b Read density heatmaps showing ATACseq signals at Tpit-dependent chromatin opening (log 2 FC <−2) in the indicated mouse genotypes. c Principal component analysis of the ATAC signals at all 16,024 Tpit-regulated chromatin opening across the tested genotypes. d Dispersion plot showing average ATACseq rlog values (assessed by Deseq2) over the log 2 fold changes of Pax7 heterozygote versus Pax7-knockout IL at all accessible regions. Differentially accessible regions (p value <0.05 and log 2 FC >±1 as computed by Deseq2) are shown as red circles. e Read density heatmap showing ATACseq signals at Pax7-dependent chromatin opening (log 2 FC <−2) in the indicated mouse genotypes. f Principal component analysis of the ATAC signals at all 7058 Pax7-regulated chromatin opening across the tested genotypes. g Hi-C interaction map (top) from mouse embryonic stem (ES) cells42 around the Pcsk2 locus showing the boundaries of the Pcsk2 TAD. Genome browser views (bottom) of the ATACseq profiles in purified pituitary cells and ILs of the indicated genotypes at the corresponding genome location. h t-SNE map colored for single-cell Pcsk2 expression showing no Pcsk2 expression in corticotropes, highest expression in melanotropes, and weak expression in gonadotropes. i Co-staining immunofluorescence for Pax7 (red) and PC2 (green) of Tpit heterozygote and Tpit knockout pituitaries from 5 days postnatal mice. Bars represent 50 μM

