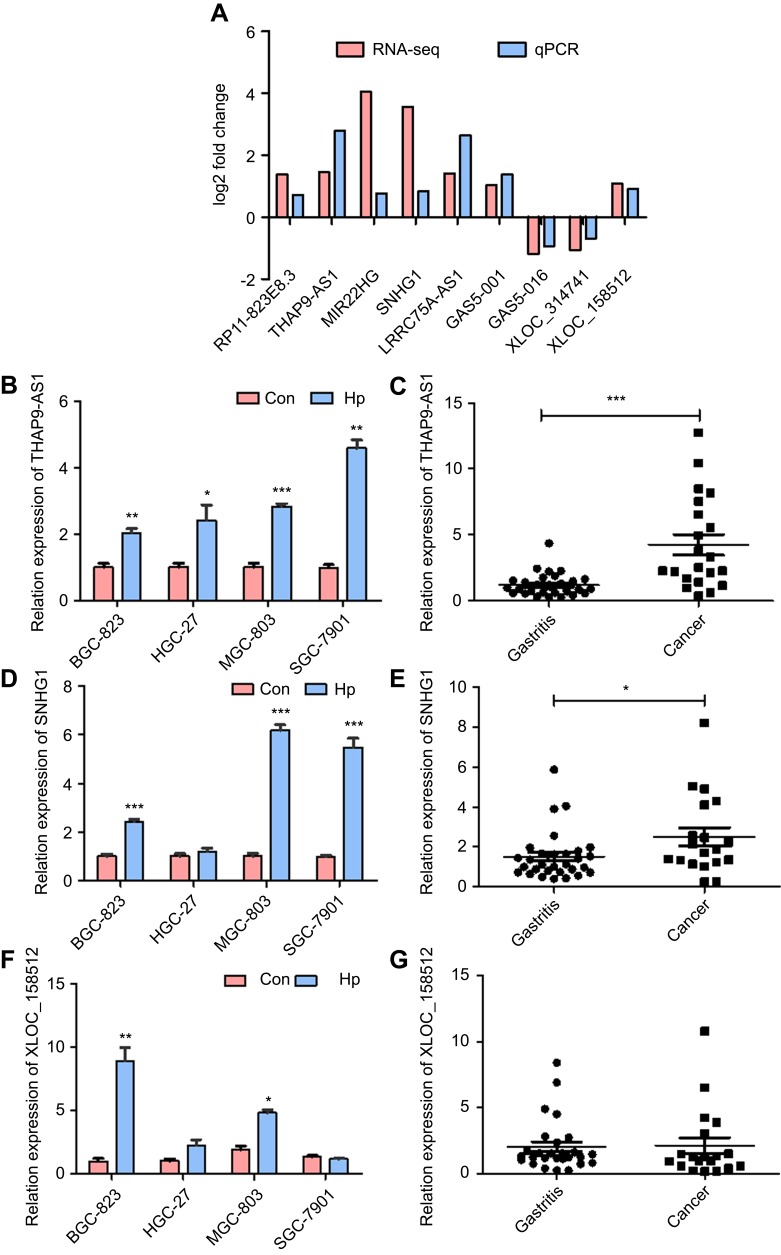
Figure 2.
Validation of the RNA-seq results and the expression level in GC cells and gastric tissues. (A) The expression level of nine randomly selected lncRNAs in H. pylori-infected and non-infected GC AGS cells detected by RNA-seq and qRT-PCR, the result between RNA-seq and qRT-PCR were consistent. (B) After the infection of H. pylori, THAP9-AS1 expression level was increased in the four GC cell lines. (C) THAP9-AS1 had higher expression in GC tissues than gastritis tissues. (D) After the infection of H. pylori, SNHG1 expression level was increased in the four GC cell lines. (E) SNHG1 had higher expression in GC tissues than gastritis tissues. (F) After infection of H. pylori, XLOC_158512 expression level was increased in BGC-823, HGC-27 and MGC-803, but decreased in SGC-7901. (G) XLOC-158512 had higher expression in GC tissues than gastritis tissues. (*P<0.05, **P<0.01, ***P<0.001).

