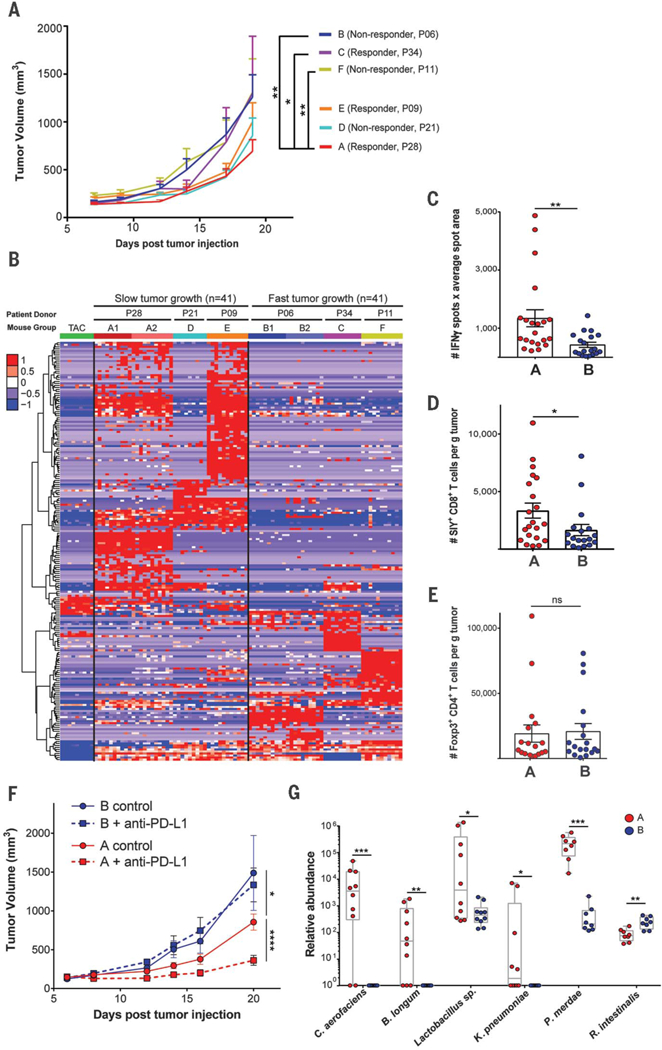
Fig. 3. Human commensal communities modulate antitumor immunity in a mouse melanoma model.

GF mice were gavaged with fecal material from three responder (P28, P34, and P09) and three nonresponder (P06, P21, and P11) patient donors. (A) B16. SIY melanoma was injected subcutaneously 2 weeks after gavage; tumor growth data are from one (groups C, D, E, and F) or two experiments (groups A and B) with 7 to 11 mice per group per experiment. Error bars represent mean + SEM. (B) Relative abundance of 207 OTUs from patient donors that colonized in mice and were differentially abundant between slow-and fast-tumor-growth groups. Columns depict individual mice arranged in groups A through F. Groups A1, B1, A2, and B2 are from two independent duplicate experiments. Rows indicate individual OTUs with exact reference ID match between human and mouse 16S rRNA data sets. (C) In groups A and B, ex vivo activation of splenocytes by SIY peptide was measured with IFN-γ ELISPOT 3 weeks after tumor injection. (D and E) Tumor-infiltrating SIY-specific CD8+ T cells (D) and FoxP3+ regulatory T cells (E) were enumerated with flow cytometry. (F) Efficacy of anti–PD-L1 therapy was determined in groups A and B. Data are from one experiment with 7 or 8 mice per group. (G) Relative abundance in mouse groups A and B of key species validated for quantitative PCR scoring. Six out of the 10 species are shown that gave positive PCR signals. The remaining four species were absent from these particular recipient groups. Tumor growth curves were analyzed with two-way analysis of variance by Tukey’s multiple comparisons post-test; flow cytometry and quantitative PCR data were analyzed by Wilcoxon-Mann-Whitney test (nonparametric). P < 0.05 was considered statistically significant; *P < 0.05, **P < 0.01, ***P < 0.001, ****P < 0.0001.
