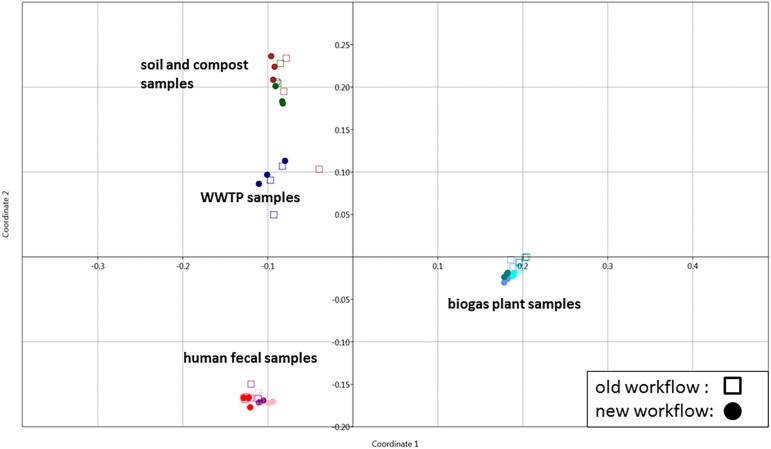
FIGURE 11.
Grouping of samples using PCoA. Principle coordinate analysis of all samples extracted with the previous (square) and the new (dots) workflow using the Past 3 tool and the Bray–Curtis distance as parameter. For analysis, all metaproteins that represented at least one percent of the identified spectra in at least one sample were considered. The samples comprise the three BGP samples 1–3 (aqua, cornflower blue, teal), the three human fecal samples 1–3 (light pink, purple, red), the WWTP samples (navy), the soil sample (brown) and the compost sample (dark green).

