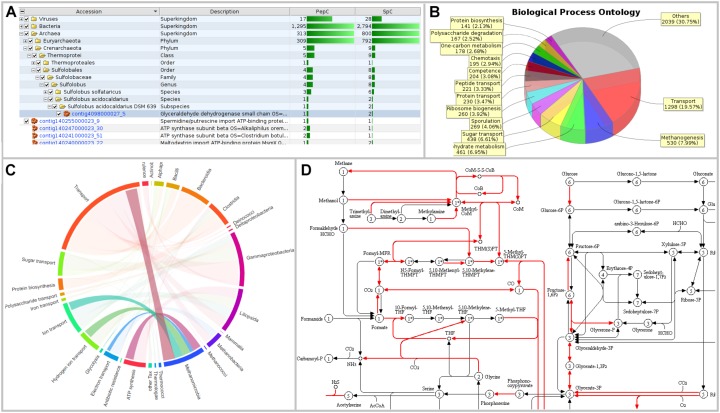
FIGURE 3.
Visualizations of MetaProteomeAnalyzer using data from NewWF_BGP_3_B. (A) The taxonomy results view of the protein tables hierarchically orders proteins by taxonomy allowing for easy selection and filtering of specific taxonomies. (B) Pie Chart with spectral counts of the biological process ontology of the Phylum Euryarchaeota selected through the taxonomy view. (C) Interactive chord diagram visualizing the relationship between taxonomy (rank = family) and functional ontology (UniProt keywords for Biological Process) (Zoun et al., 2017). Biological processes for Methanosarcinaceae, as an example, are highlighted. (D) KEGG pathway map for central carbon metabolisms (KEGG map 01200) highlighting enzymes identified with the MPA.

