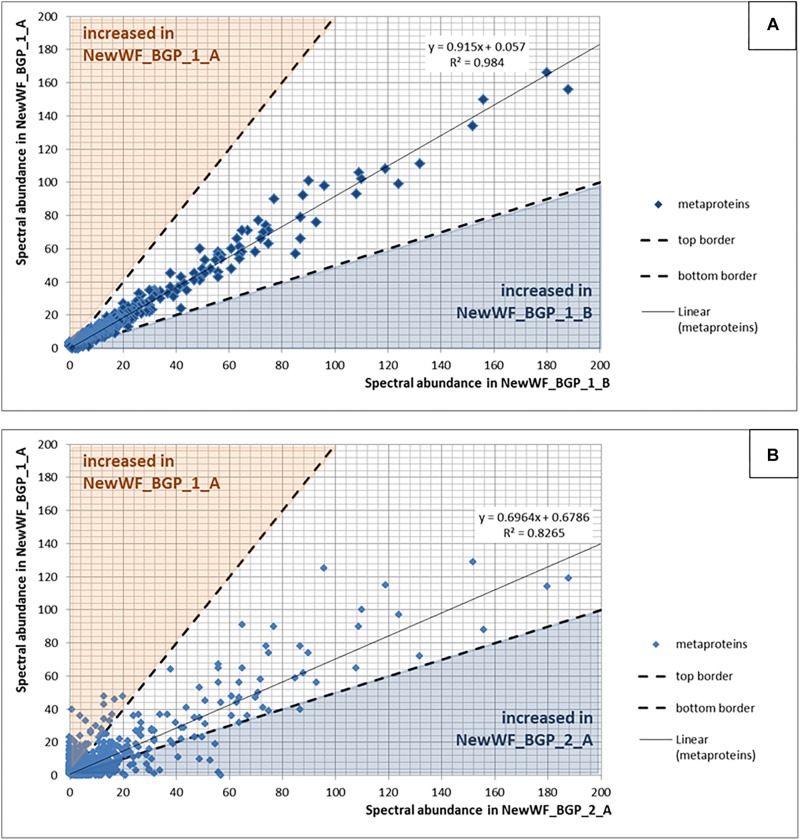
FIGURE 8.
(A) Reproducibility using replicated samples. The spectral counts of the metaproteins from the sample NewWF_BGP_1_A were plotted against the spectral counts of the metaproteins from the sample NewWF_BGP_1_B. The points in the blue or the orange area are at least doubled in the corresponding sample. (B) Differences between samples. The spectral counts of the metaproteins from the sample NewWF_BGP_1_A were plotted against the spectral counts of the metaproteins from the sample NewWF_BGP_2_A. The points in the blue or the orange area are at least decreased (blue) or increased (orange) twofold.

