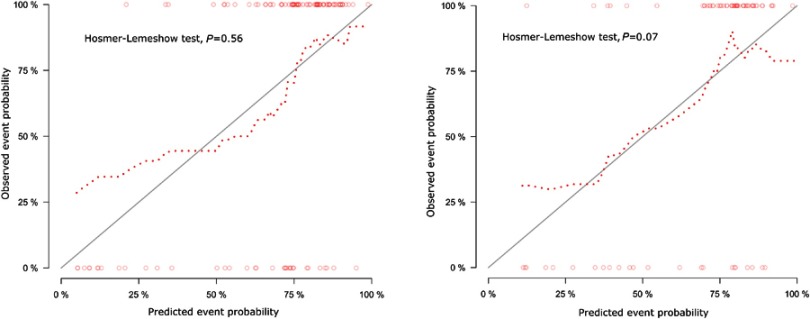
Figure 5.
Calibration curves of radiomics model in training cohort (A) and validation cohort (B). Calibration curve evaluated the correspondence between the predicted probabilities and observed probabilities. The closer the dot line to the grey solid line, the better prediction of the model was. Besides, according to Hosmer-Lemeshow test, the predicted probabilities have no significantly difference with observed probabilities with p>0.05.

