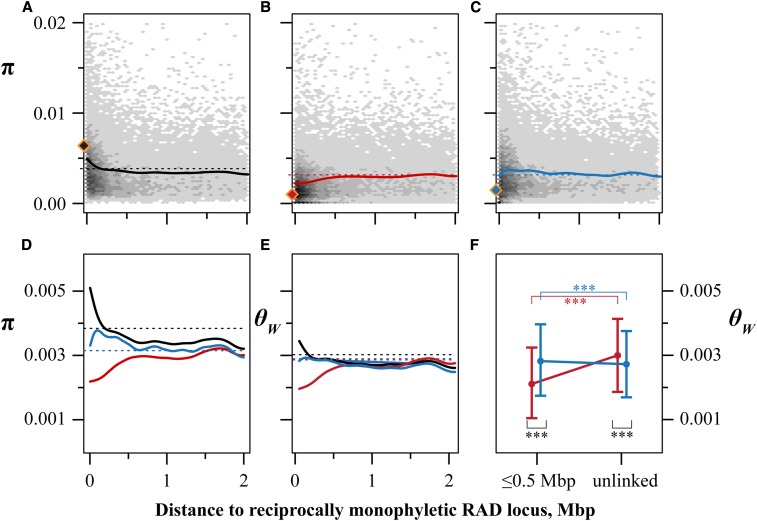
Figure 3.
Patterns of sequence variation differ on marine and freshwater stickleback chromosomes. (A–C) Genome-wide sequence diversity (π) as a function of the distance from a RAD locus with reciprocal monophyly of marine and freshwater haplotypes. Diamonds show average sequence diversity among reciprocally monophyletic RAD loci. Density of RAD loci at x distance from the nearest reciprocally monophyletic locus with y level of diversity is shown in shades of gray. Bold lines are smoothed splines, dashed lines are genome-wide means. (A) Sequence diversity in the combined dataset [marine (RS) + freshwater (BT and BP)]. (B) Sequence diversity on chromosomes carrying marine haplotypes. (C) Sequence diversity on chromosomes carrying freshwater haplotypes. (D) Smoothed splines as in (A–C). (E) Splines as in (A–D) of Watterson’s θ. (F) θW of RAD loci within 0.5 Mbp of a reciprocally monophyletic RAD locus and on chromosomes not carrying a reciprocally monophyletic locus (“unlinked”). Data are means ± 1 SD ***P < 0.001.

