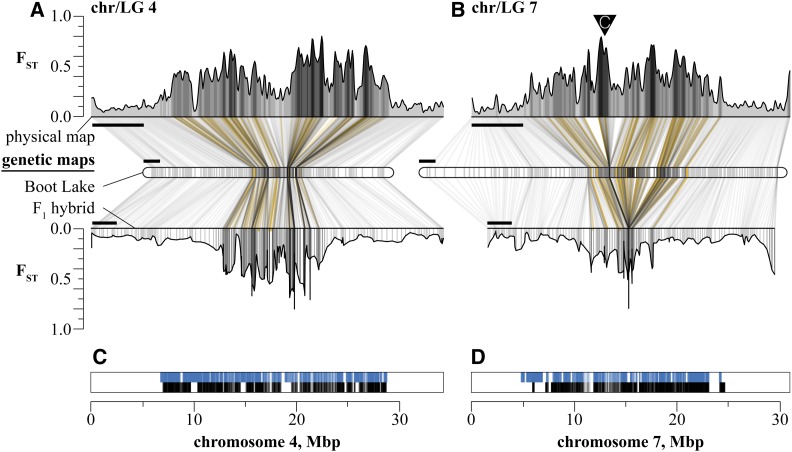
Figure 6.
The recombination landscape extends the genomic reach of divergent selection. (A and B) RS-BT FST scans were performed on the physical map (top, Bar, 5 Mbp) and imputed onto the freshwater and F1 hybrid genetic maps (middle and bottom, Bar, 10 cM) for chromosomes 4 and 7. Lines connect evenly spaced windows on the physical map to the imputed positions on each genetic map and are shaded by the kernel-averaged FST for that window. Positions of divergent RAD loci are shown in gold. The inverted triangle represents the position of centromeric repeats (Sardell et al. 2018). (C and D) physical positions of all RAD loci within 0.2 cM from a divergent locus on the freshwater map (blue lines) and the F1 hybrid map (black lines).

