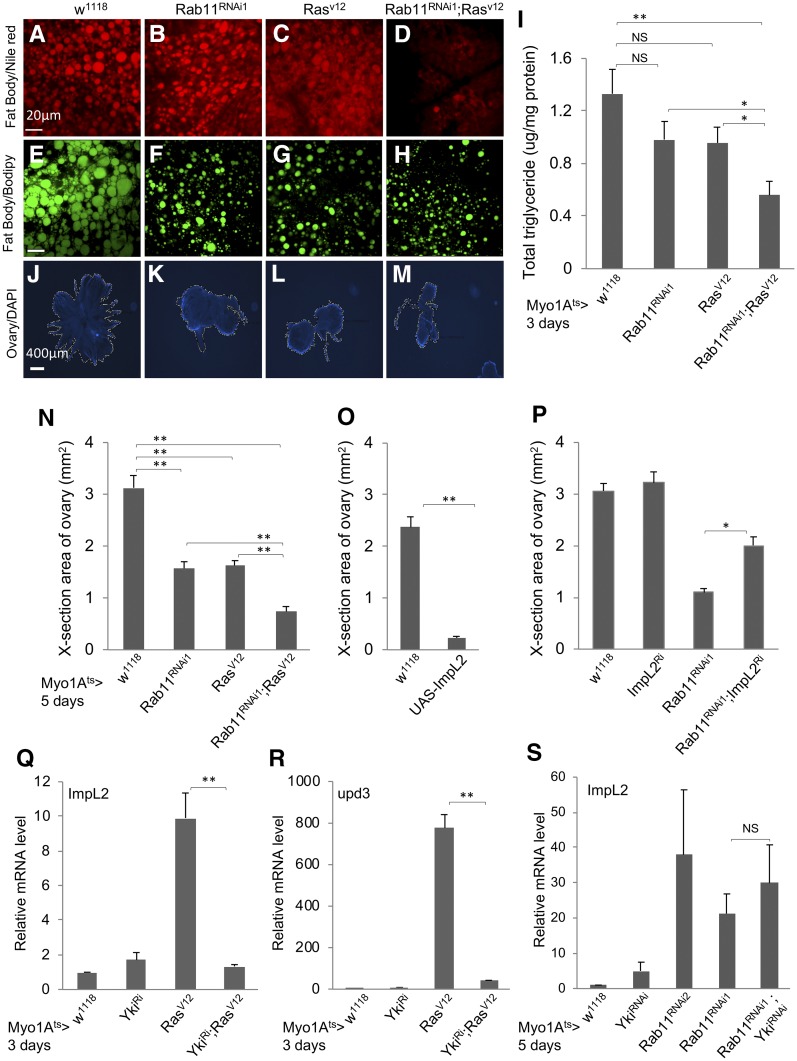
Figure 4.
Loss of Rab11 and expression of ImpL2 in midgut regulate the metabolism of neighboring tissues. (A–D) The Myo1Ats > GFP flies were crossed with flies of genotypes indicated at the top of the images. The resulting adult flies were shifted to 29° for 5 days and the abdomens were used for Nile Red staining for lipid droplets. These are higher magnifications of the images shown in Figure S3, A–D. (E–H) Flies from crosses the same as A–D were used for a parallel Bodipy staining for lipid droplets. Bar, 20 μm. (I) Whole flies from crosses the same as A–D were used for homogenization, and the extracts were used for total triglyceride measurement and also total protein measurement, which was used as the internal control for normalization. The normalized value for total triglyceride is plotted as shown. (J–M) DAPI-stained fluorescent images of ovaries dissected from adult flies with the same genotypes, as indicated at the top. (N) Quantification of the cross-section areas of the ovaries as shown in J–M. More than 10 images of each genotype were used to measure the area, and the average area of each genotype is plotted as shown. (O) Measurement of ovary cross-section areas from control flies and flies containing an overexpression construct of ImpL2 complementary DNA (cDNA). The expression was driven by the Myo1Ats > GFP in ECs, and the temperature shift was for 5 days before ovary dissection and image analysis. (P) A similar assay for ovary cross-section areas, using flies containing the combination of Rab11 RNAi and ImpL2 RNAi constructs. The expression of the transgenic dsRNA constructs was driven by Myo1Ats > GFP, and the temperature shift was for 5 days before ovary dissection and image analysis. (Q–S) Expression of ImpL2 or upd3 RNA by qPCR of total RNA from dissected guts of flies containing the yki RNAi, Rab11 RNAi, RasV12 overexpression, or combinations of the constructs. The driver was Myo1Ats > GFP and the temperature shift was for 3 or 5 days as indicated before gut dissection and RNA preparation. The RNA expression in each set of experiments was normalized to that of rp49 and set as 1 for the Myo1Ats > crossed with w1118 control samples. The expression level in other samples was plotted as fold increase.

