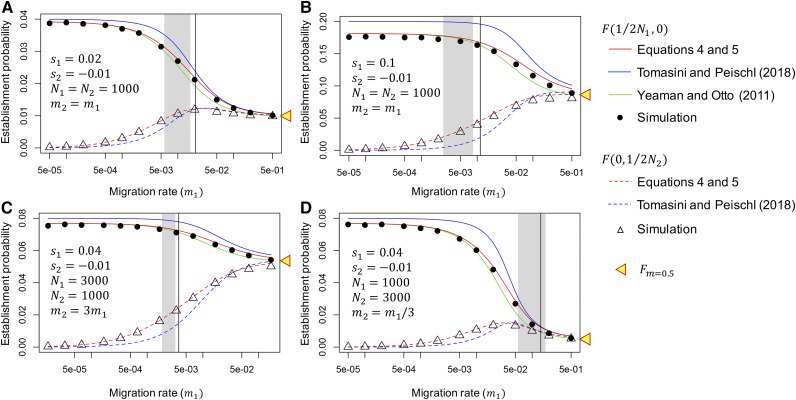
Figure 3.
Establishment probability as a function of migration rate. (A) Weak selection ( and ) and (B) strong selection ( and ) are assumed in a symmetric model . (C and D) Asymmetric population settings are considered ( in C and in D). Our result in red is compared with those of Yeaman and Otto (2011) and Tomasini and Peischl (2018), together with the result of our forward simulation. The establishment probability for a mutation that arises in subpopulation I is shown by solid lines and closed circles, and that for a mutation that arises in subpopulation II is shown by broken lines and open triangles. The establishment probability at the high migration limit is shown by a yellow triangle. In each panel, a gray region is placed such that the proportion of the replications where two alleles (A and a) coexisted in the left, while in the right. The vertical line presents the critical migration rate, above which allele A fixes in the entire population, obtained by Equation 6 (see text for detail).

