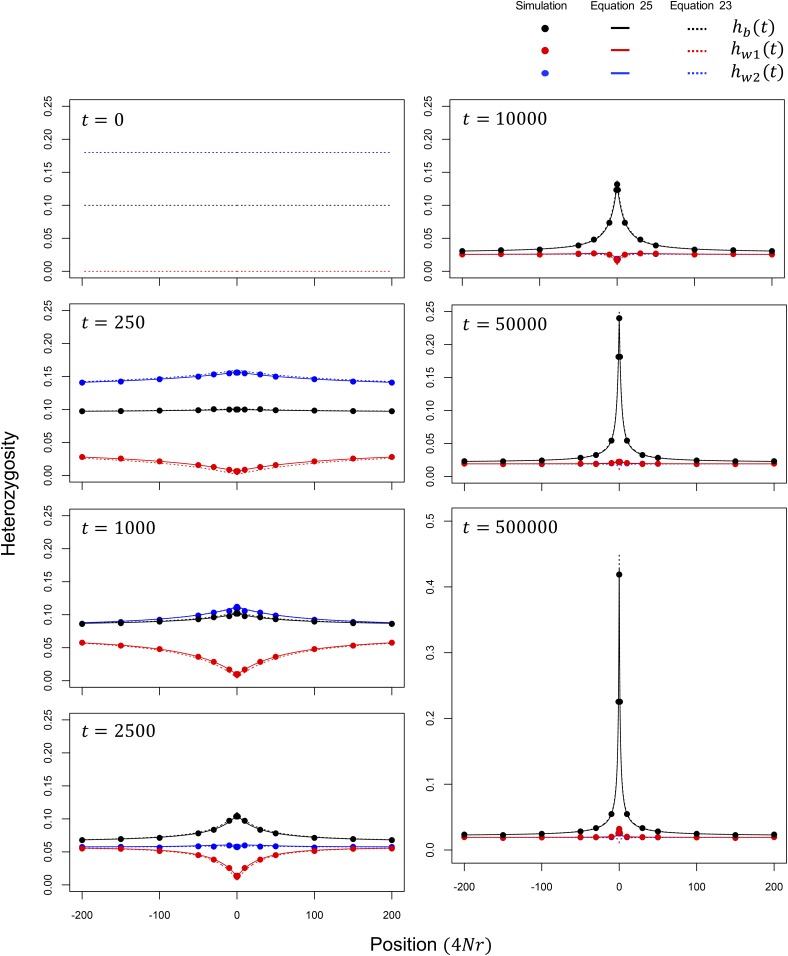
Figure 5.
Temporal change of heterozygosity after a local sweep in subpopulation I. The spacial distributions of , and are shown for seven time points (t = 0, 250, 1000, 2500, 10,000, 50,000, and 500,000 generations after a sweep). Position in the simulated regions is shown in from the selected site. , and are assumed. Theoretical results from Equations 23 and 25 are shown by broken and solid lines, respectively. Simulation results (closed circles) are the averages over 50,000 replications of forward simulations.

