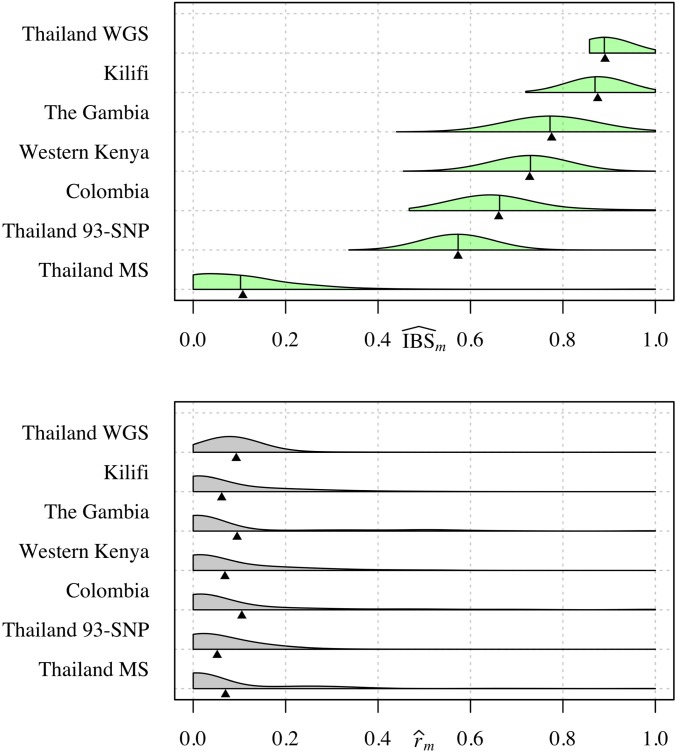
Figure 5.
Measures of relatedness: parasite pairs with unknown relatedness. Half-violin plots showing distributions of (top) and (bottom), based on pairwise comparisons of Plasmodium monoclonal samples from six published P. falciparum biallelic SNP data sets (Table 1) and a single P. vivax MS data set (Thailand MS). Black vertical bars denote (top), and triangles denote the mean (top) and mean (bottom). IBS, identity-by-state; MS, microsatellite; WGS, whole-genome sequencing.

