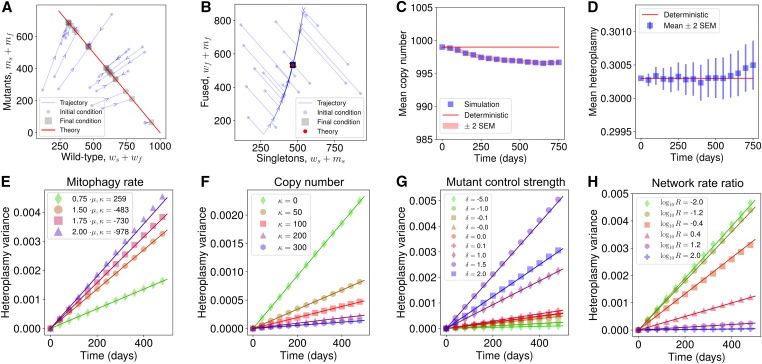
Figure 2.
General mathematical principles linking heteroplasmy variance to network dynamics. (A) Wild-type and mutant copy numbers and (B) fused and unfused copy numbers both move toward a line of steady states under a deterministic model, as indicated by arrows. In stochastic simulation, (C) mean copy number is initially slightly perturbed from the deterministic treatment of the system and then remains constant, while (D) mean heteroplasmy remains invariant with time (see Equation S61). (E–H) We show that Equation 13 holds across many cellular circumstances: lines give analytic results, points are from stochastic simulation. Heteroplasmy variance behavior is successfully predicted for varying (E) mitophagy rate, (F) steady-state copy number, (G) mutation sensing, and (H) fusion rate. In H, fusion and fission rates are redefined as and where M and R denote the relative magnitude and ratio of the network rates, and denote the nominal parameterizations of the fusion and fission rates, respectively (see Table S2). Figure S3D shows a sweep of M over the same logarithmic range when . See Figure S4, A–I, and Table S3 for parameter sweeps numerically demonstrating the generality of the result for different mtDNA control modes.

