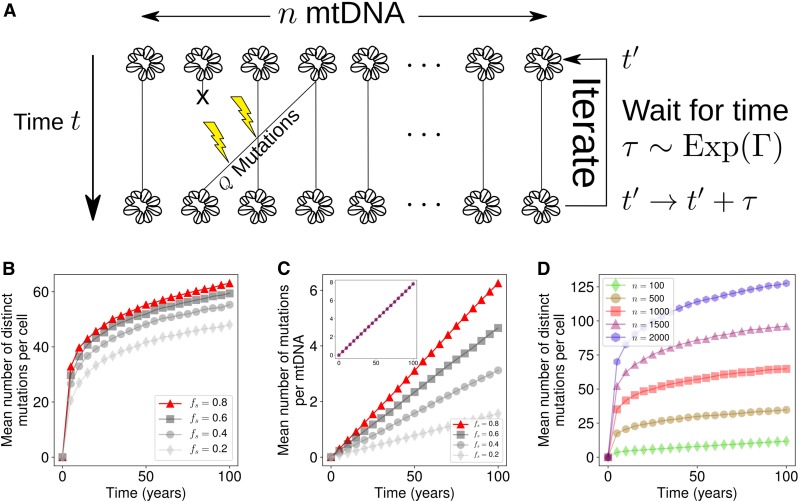
Figure 3.
Rate of de novo mutation accumulation is sensitive to the network state/mitophagy rate and copy number for a time-rescaled infinite sites Moran model. (A) An infinite sites Moran model where Q mutations occur per Moran step (see Equation 14). (B–D) Influence of our proposed intervention strategies. (B) Mean number of distinct mutations increases with the fraction of unfused mitochondria. This corresponds to a simple rescaling of time, so all but one of the parameterizations are shown in gray. (C) The mean number of mutations per mtDNA also increases with the fraction of unfused mitochondria. Inset shows that the mean number of mutations per mtDNA is independent of the number of mtDNAs per cell; values of n are the same as in D. (D) Mean number of mutations per cell increases according to the population size of mtDNAs. Standard error in the mean is too small to visualize, so error bars are neglected, given realizations.

