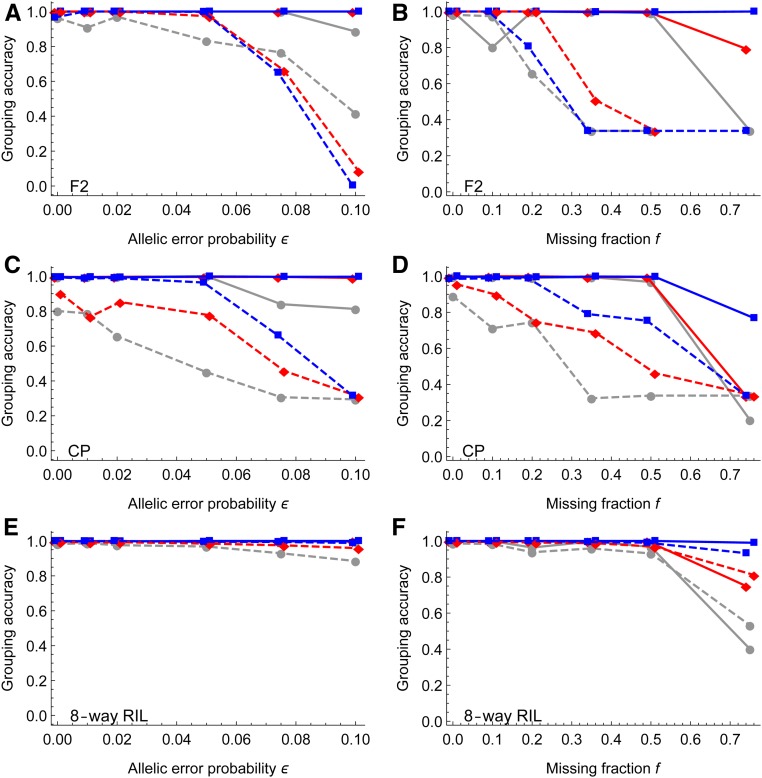
Figure 3.
Simulation evaluation of marker grouping. The left panels show the effects of allelic error probability, and the right panels for the effects of missing fraction. The solid lines denote the results of magicMap, and the dashed lines denote the results of the alternative methods, which are MSTmap, Lep-MAP3, and mpMap for the F2 (A and B), the CP (C and D), and the eight-way RIL (E and F), respectively. The gray circles (○), red diamonds , and blue rectangles (□) refer to small, medium, and large population sizes, respectively; the x-coordinates are jittered to avoid overlapping.

