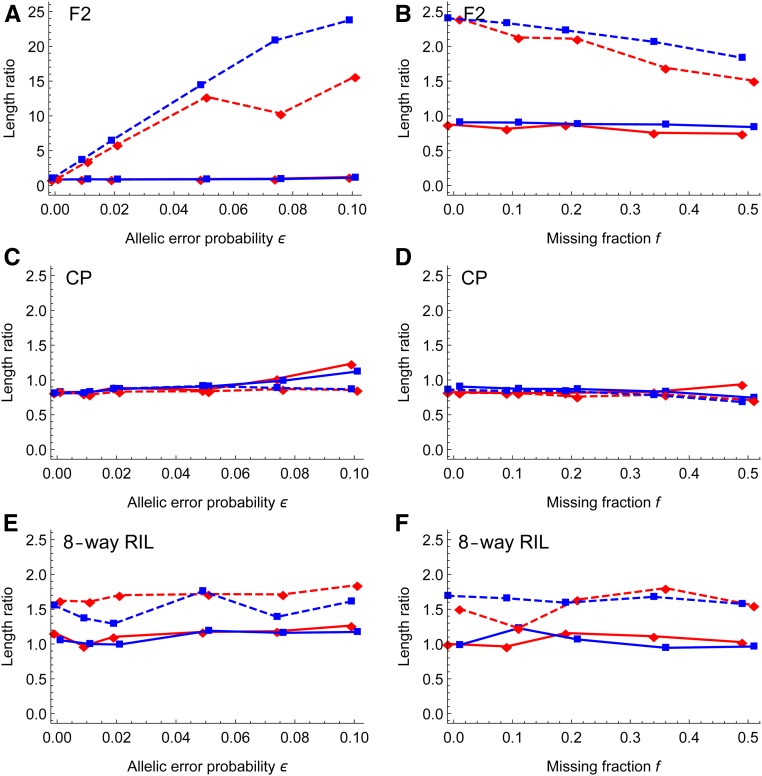
Figure 5.
Simulation evaluation of marker spacing. The y-axis denotes the ratio of estimated chromosome length to the true value. The left panels show the effects of allelic error probability, and the right panels show the effects of the missing fraction. The solid lines denote the results of magicMap, and the dashed lines denote the results of the alternative methods, which are MSTmap, Lep-MAP3, and mpMap for the F2 (A and B), the CP (C and D), and the eight-way RIL (E and F), respectively. The red diamonds and blue rectangles (□) refer to medium and large population sizes, respectively.

