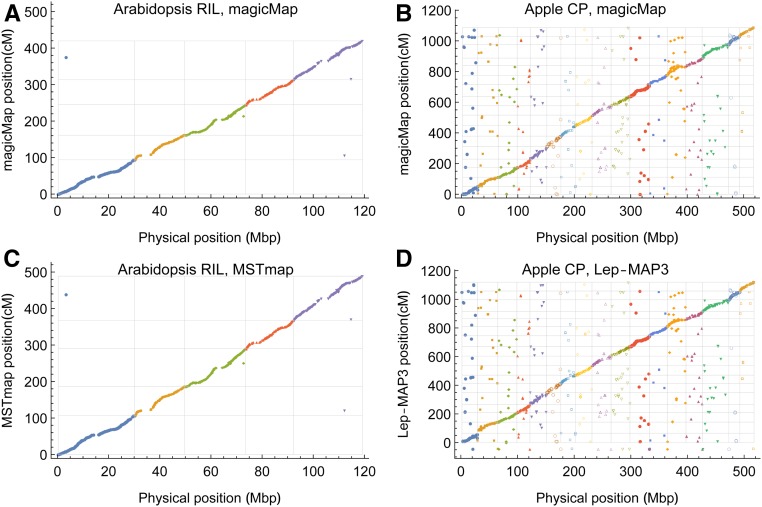
Figure 6.
Evaluation of magicMap performances by the real Arabidopsis 2-way RIL (A and C) and the apple CP (B and D). The gray grid lines denote the chromosome boundaries, and the dots with negative y-values denote the ungrouped markers. (A and B) Genetic map constructed by magicMap vs. the physical map. (C) Genetic map constructed by MSTmap vs. the physical map. (D) Genetic map constructed by Lep-MAP3 vs. the physical map.

