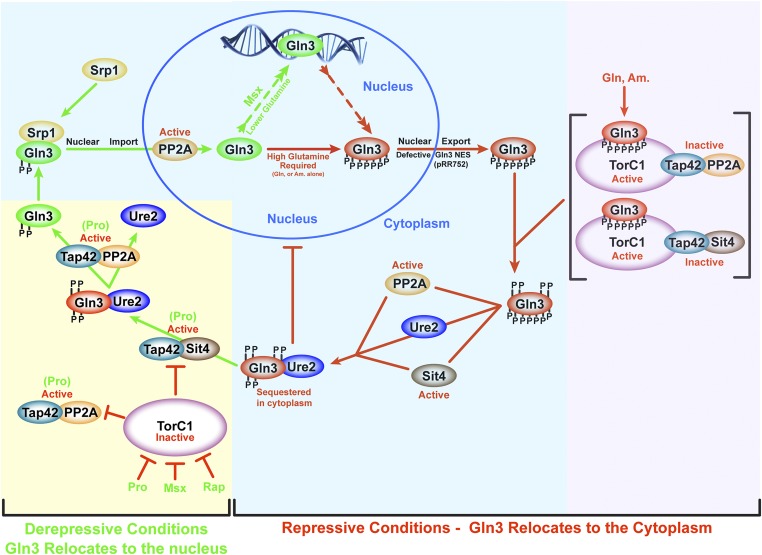
Figure 11.
Schematic working summary of data investigating PP2A and Sit4 phosphatases in the regulation of Gln3 under repressive [glutamine (Gln), ammonia (Am.) as nitrogen source; red arrows or bars] or derepressive [proline (Pro) as nitrogen source, or following rapamycin or Msx treatment; green arrows)] conditions. The phosphate groups indicated in the diagram are only illustrative of relative degrees of phosphorylation. It is important to emphasize that the specific order of the depicted reactions are not known beyond the limits of the data and conclusions presented in the Discussion. Yellow and purple background highlighting indicates TorC1-dependent phosphatase regulation, whereas blue background highlighting indicatesTorC1-independent phosphatase regulation.

