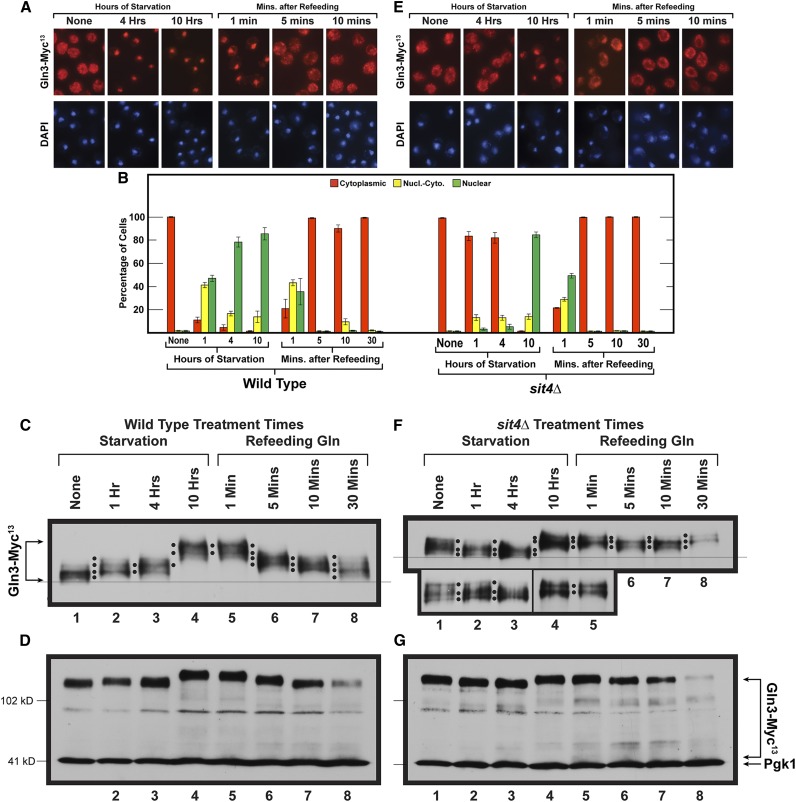
Figure 5.
Time course of Gln3-Myc13 intracellular localization and Gln3-Myc13 phosphorylation in short- and long-term nitrogen starvation of wild-type (A and B left side, C and D) and sit4Δ mutant (B right side, E–G) cells followed by the refeeding of excess nitrogen. Wild-type (TB123) and sit4Δ mutant (TB136-2a) cells were pregrown in YNB-glutamine medium, then transferred to nitrogen-free medium and sampled as described for 1, 4, and 10 hr. After 10 hr of starvation, glutamine was added to a final concentration of 0.1%, and sampling continued at the indicated times. Wild-type and sit4Δ cultures were processed for indirect immunofluorescence imaging as described in Materials and Methods. Data in (B), left side are averages and SD derived from seven biological replicates of starvation, and three biological replicates for refeeding. For sit4Δ cells, four and two biological replicates, respectively, were used for the starvation and refeeding portions of the experiments. For each time point, data derived from wild type (B left side) vs. sit4Δ (B right side) were compared to ascertain whether there were significant, mutant-dependent differences in the outcomes. Since the number of cells scored in each sample varied (average = 248; SD = 29), it was necessary to generate P values by comparing the number of cells in each cellular compartment of wild-type cells (cytoplasmic, nuclear-cytoplasmic, nuclear) at each time point to those in each parallel cellular compartment of sit4Δ cells at each of the parallel time points using a three-way ANOVA with cell type, condition-time, and location as the main effects with all possible two- and three-way interactions included in the model. The calculated P values were: None (0.9999, 0.9999, 0.9999); Starvation 1 hr (<0.0001, <0.0001, <0.0001); Starvation 4 hr (<0.0001, 0.3000, <0.0001); Starvation 10 hr 0.9145, 0.9999, 0.8439; Refeeding 1 min (0.9284, 0.0108, 0.0139); Refeeding 5 min (0.8574, 0.999, 0.9999); Refeeding 10 min (0.0932, 0.1137, 0.9687); Refeeding 30 min (0.9046, 0.9522, 0.9999), respectively. Localizations were considered to be different if the observed P values were <0.05. Upper panels (C and F) data derived from a six percent acrylamide gel, whereas the lower panels (D and G) data derived from a parallel sample of the same culture, but electrophoresed for a shorter time in a 7% gel to maintain the loading control, Pgk1, within the gel. Molecular weight standards are indicated.

