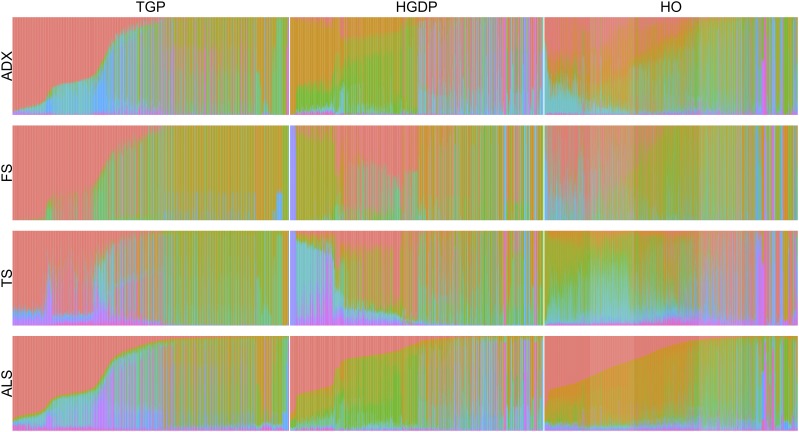
Figure 11.
The admixture proportions of each globally sampled dataset as a stacked barplot. Because of the nonidentifiability of the model, the order of the rows of are arbitrary. To disambiguate this, we order the rows of in each dataset by decreasing average admixture. The coloring in Figure 11 is then done according to this ordering. As an aid to the eye, we also reorder the columns of according to decreasing proportion of the first row of of the ALStructure fit. The choice to order all fits according to ALStructure is arbitrary; however, all fits must be ordered consistently to make meaningful comparisons possible. As can be seen, each of the fits differ significantly from each other on every dataset.

