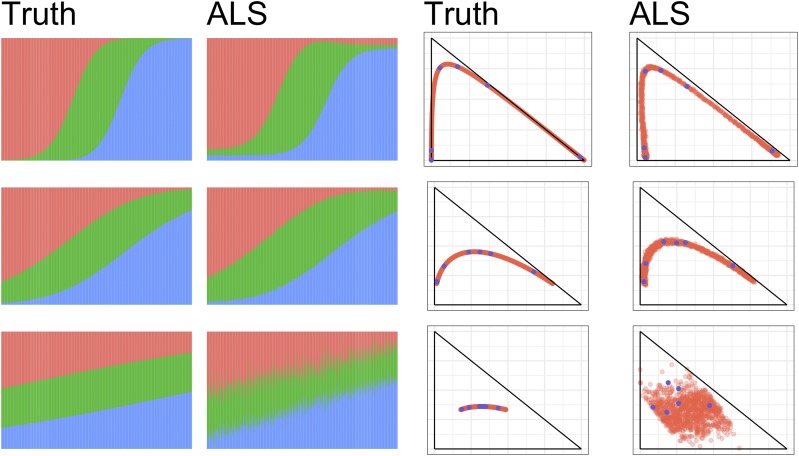
Figure 6.
ALStructure fits of datasets from the Spatial model. (left) Stacked barplots of ALStructure fits. (right) Biplots of ALStructure fits. The parameter σ was set to 0.5, 1, and 2 for the top, middle and bottom rows, respectively. Blue points are plotted as a visual aid and delineate corresponding columns of and .

