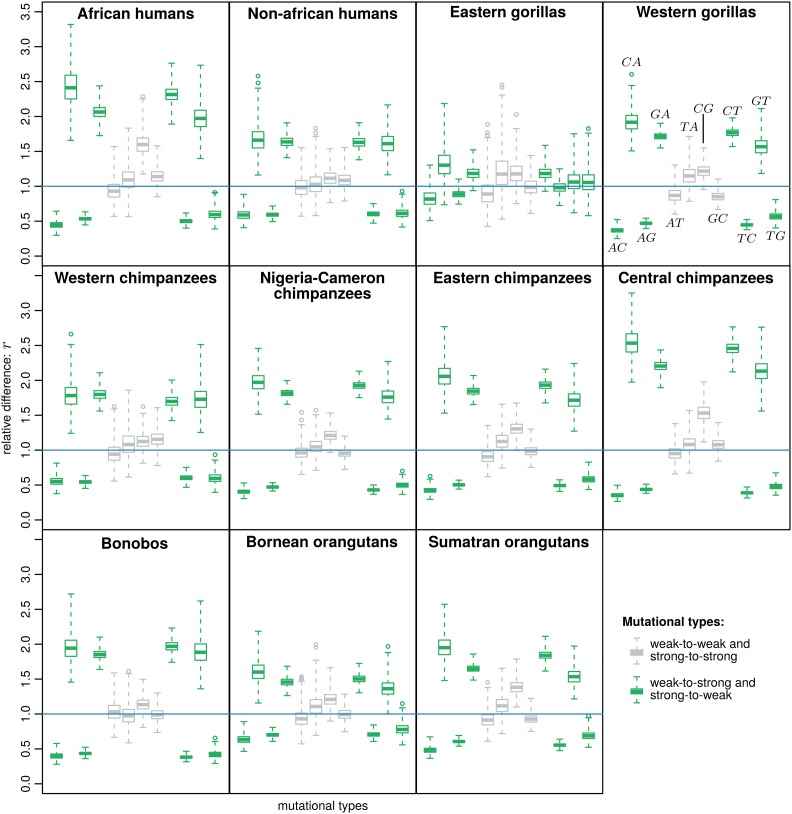
Figure 4.
Relative difference in the mutation rates estimated under the neutral and non-neutral Moran model. represents the ratio between the mutation from allele to allele in the model with allelic selection and the model with boundary mutations: . The 12 mutational types are indicated in the western gorillas plot: all of the plots follow this arrangement.

