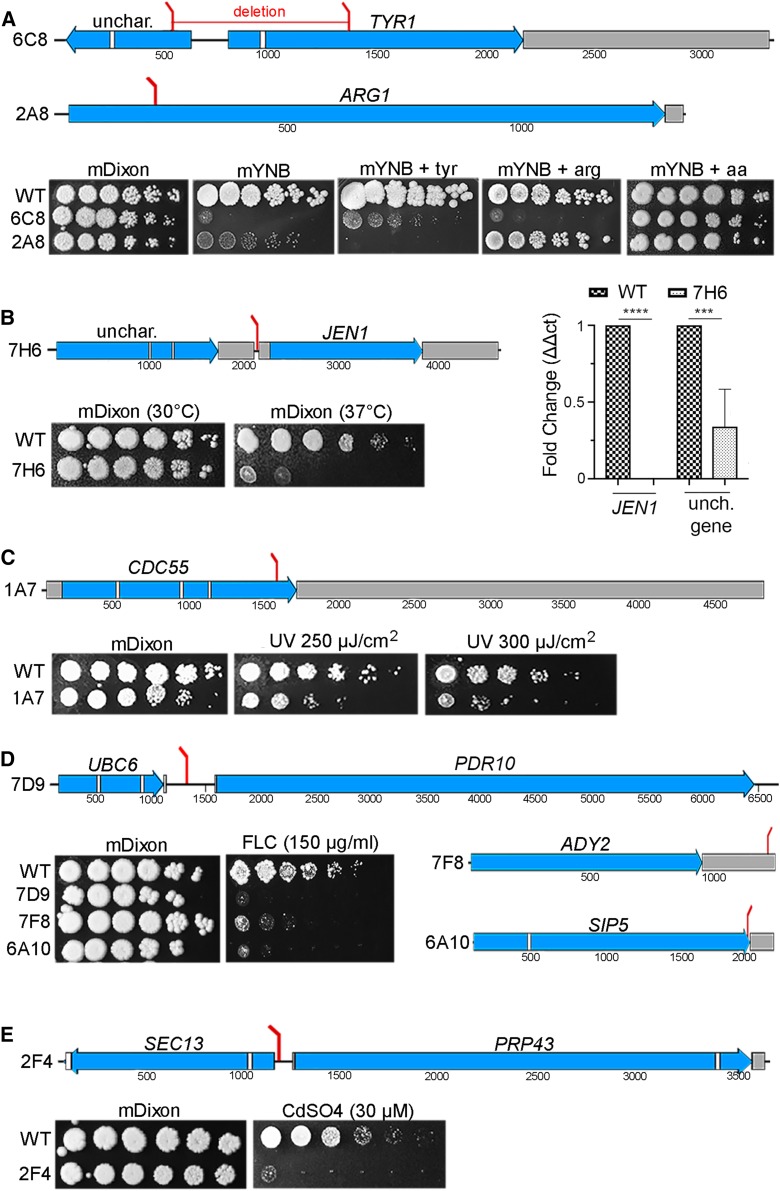
Figure 3.
Position of T-DNA insertions in M. furfur mutants and their associated phenotypes. Each section shows mutants sensitive to the same stress or condition, such as reduced growth on mYNB medium (A), reduced growth at 37° (B), and sensitivity to UV light (C), FLC (D), or CdSO4 (E). The positions of the T-DNA insertions are indicated by red bars, and in the same panel the phenotypes of the mutants are also shown. Exons are represented in blue, introns in white, and UTRs in gray. In the qPCR of (B) **** P < 0.0001 and *** P < 0.001 for each pairwise comparison. FLC, fluconazole; mDixon; modified Dixon’s media; qPCR, quantitative PCR; T-DNA, transfer DNA; unch./unchar., uncharacterized; WT, wild-type; mYNB, minimal yeast nitrogen base.

