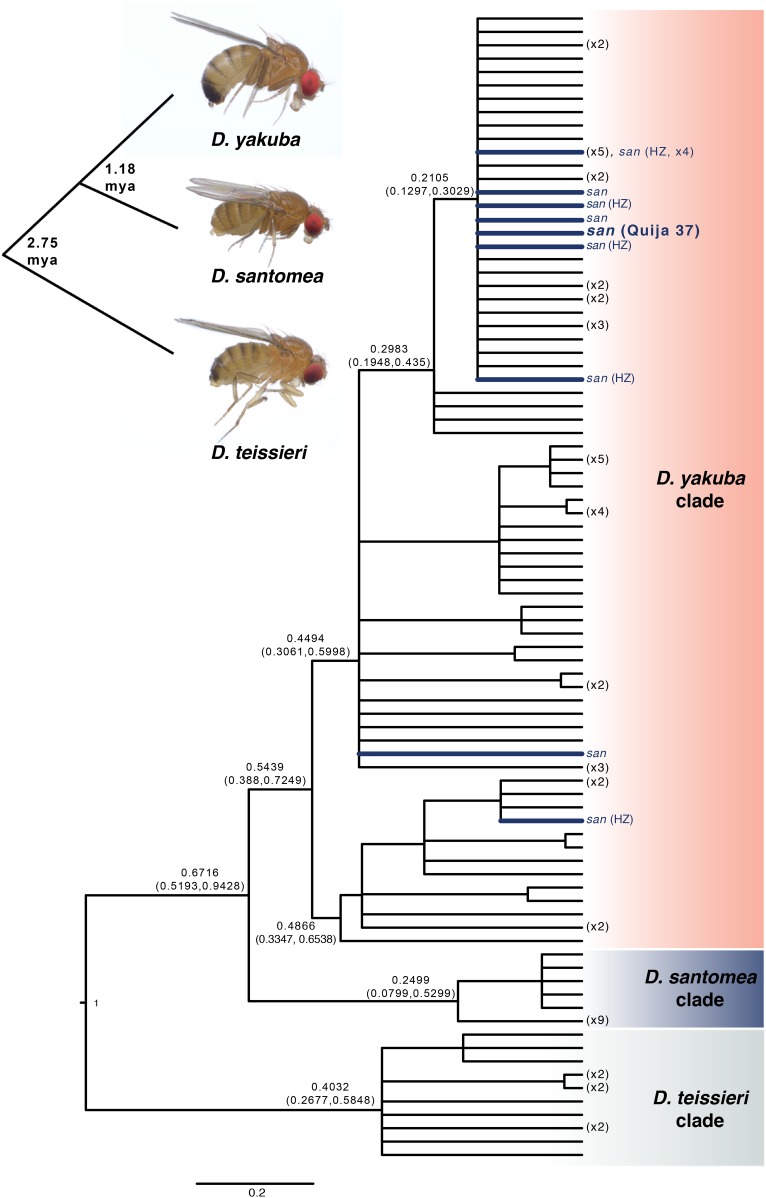
Figure 1.
Bayesian relative chronogram for the D. yakuba clade mtDNA. The root age was fixed to 1. Nodes with posterior probability <0.95 were collapsed into polytomies, numbers at the tips show the number of genotypes collapsed. Node labels are the point estimates and 95% credible intervals for the relative ages. Tips and branches showing D. santomea individuals with D. yakuba mtDNA are colored blue, those sampled from the Pico de São Tomé hybrid zone are denoted by HZ. D. santomea line Quija 37 showing evidence of horizontal or paternal Wolbachia transmission (or paternal mtDNA transmission) is in bold blue. The chronogram was estimated from the 13 protein-coding mitochondrial genes. A representation of host nuclear relationships with photos of host females at the tips is inset, with the divergence times estimated by Turissini and Matute (2017) superimposed.

