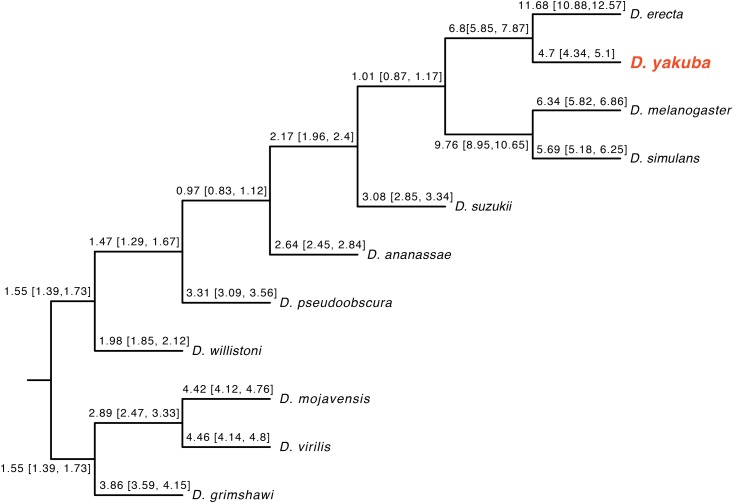
Figure 4.
A Bayesian phylogram, with branch lengths fixed to 1, displaying relative rate variation for mtDNA vs. nuclear loci. Branches are labeled with quartiles of the estimated third-position mtDNA to third-position nuclear substitution rate. The nuclear substitution rate was taken as the arithmetic mean third-position rate over the 20 loci used. The mtDNA and nuclear phylograms are topologically identical when run separately.

