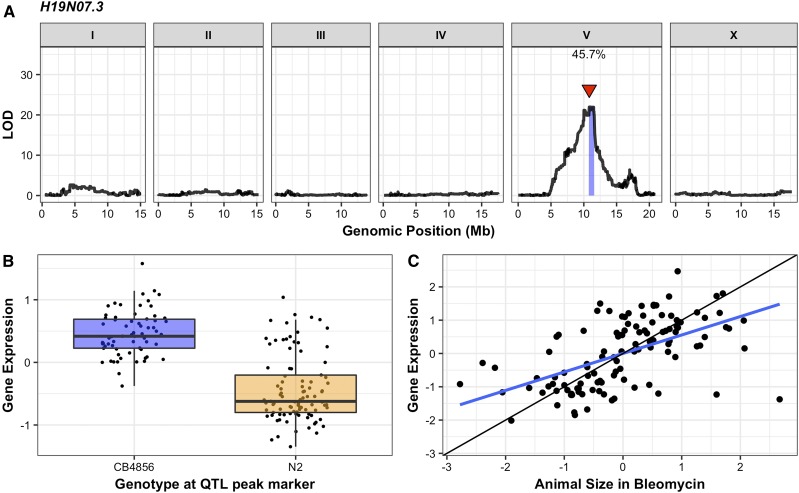
Figure 4.
Linkage mapping of the H19N07.3 expression difference among RIAILs is shown. (A) On the x-axis, each of 13,003 genomic markers, split by chromosome, were tested for correlation with H19N07.3 expression variation across the RIAIL panel. The LOD score for each marker is reported on the y-axis. The significant QTL is indicated by a red triangle at the peak marker, and a blue ribbon shows the 95% confidence interval around the peak marker. The total amount of expression variance across the RIAIL panel explained by the genotype at the peak marker is printed as a percentage. (B) RIAIL gene expression (y-axis), split by allele at the QTL peak marker (x-axis) is shown. Phenotypes of RIAILs containing the N2 allele (orange) are compared to RIAILs containing the CB4856 allele (blue). Phenotypes are shown as Tukey box plots, and each point is the H19N07.3 expression of an individual strain. (C) The correlation between animal size in bleomycin and H19N07.3 expression is shown as a scatterplot, with each RIAIL shown as a point. Each axis was scaled to have a mean of zero and a SD of one. The line of best fit is shown in blue. The identity line is shown in black for reference.

