FIGURE 1.

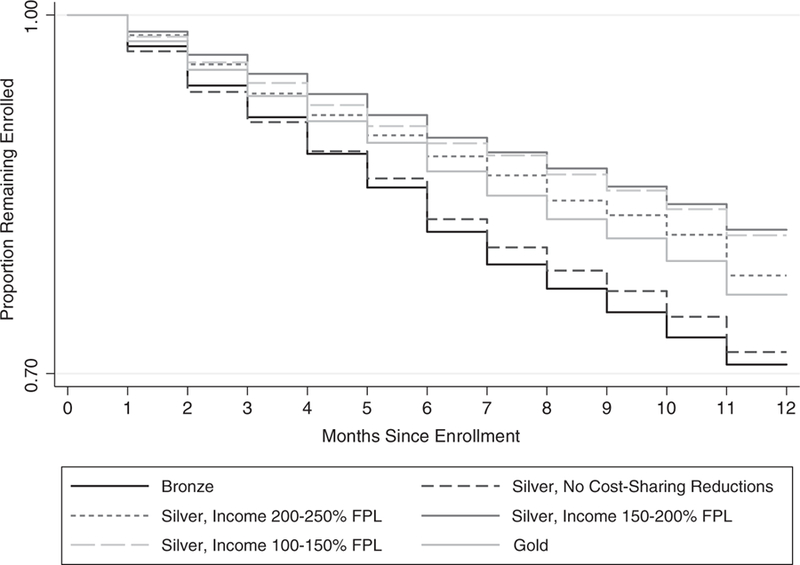
Kaplan-Meier survival curves of enrollment in Marketplace coverage, by plan actuarial value in order to differentiate disenrollment across plans, the y-axis was limited to the range of observed probabilities, 0.70–1.00 (2014–2016).

Kaplan-Meier survival curves of enrollment in Marketplace coverage, by plan actuarial value in order to differentiate disenrollment across plans, the y-axis was limited to the range of observed probabilities, 0.70–1.00 (2014–2016).