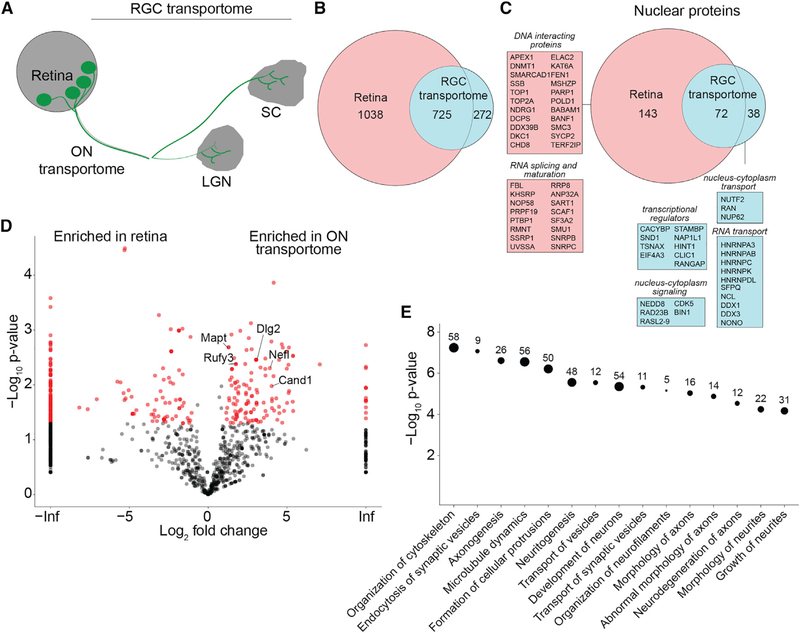
Figure 3. Proteomic Analysis of the RGC and Optic NerveTransportomes.
(A) Diagram of the retinal projection to LGN and SC. The RGC transportome includes the biotinylated proteins transported from retina to ON, SC, and LGN.
(B) Venn diagram of the population of biotinylated proteins in the retina compared with the RGC transportome.
(C) Venn diagram of the populations of biotinylated nuclear proteins in the retina and in the RGC transportome. Nuclear proteins in the RGC transportome are involved in signaling between the nucleus and the cytoplasm, transcriptional regulation, and RNA transport. Nuclear proteins in the retina, but not in the RGC transportome, are DNA-interacting proteins and RNA-splicing and -maturation factors.
(D) Volcano plot comparing biotinylated proteins in the retina and the ON transportome. The plot shows the log2-fold change in enrichment of normalized spectral counts for each protein in the retina and the ON transportome against the –log10 p value, a measure of statistical significance. Proteins marked in red are significantly different between the 2 datasets, n = 3, p < 0.05, t test with Benjamini-Hochberg correction. Data points plotted on the left or right y axes represent proteins that are only detected in one type of dataset.
(E) Ingenuity analysis of the categories of most significantly enriched proteins in the ON transportome. Proteomic data used to generate these figure panels are shown in Table S1. Right-tailed Fisher’s exact test.

