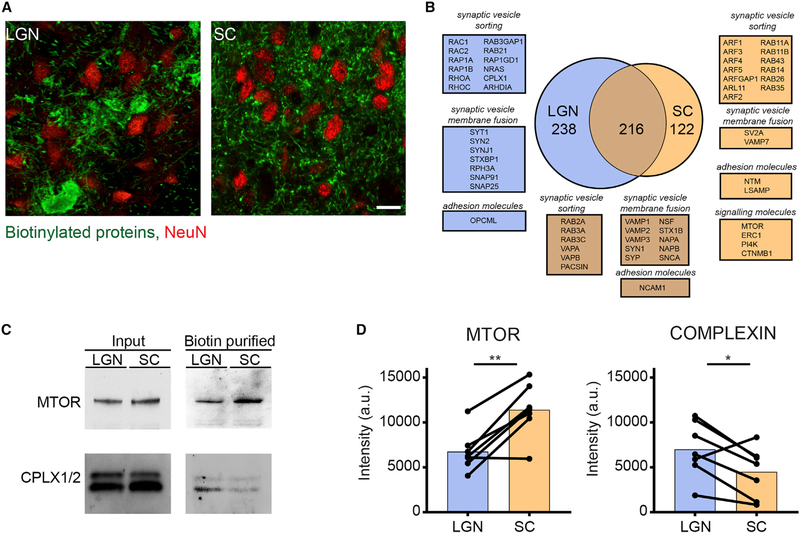
Figure 6. Comparison of LGN and SC Transportomes.
(A) Confocal single-optical sections through LGN (left) and SC (right) showing the distribution of biotinylated proteins (green) in characteristic clustered presynaptic profiles in LGN and more evenly distributed presynaptic profiles in superficial layers of SC. Local neuronal somata in LGN and SC were labeled with NeuN antibodies (red). Scale bar, 50 μm.
(B) Venn diagram of LGN and SC transportomes shows that proteins unique to each transportome include different families of GTPases.
(C and D) Western blot validation (C) and quantification (D) of biotinylated proteins in SC and LGN. NeutrAvidin enrichment of both samples showed an enrichment of MTOR in SC and CMPLX½ in LGN. Quantification of samples was performed with normalized optic density of each blot. MTOR, n = 7, **p = 0.005, COMPLEXIN, n = 7, *p = 0.03, two-tailed Student’s t test.
See Table S4 for proteomic data.

