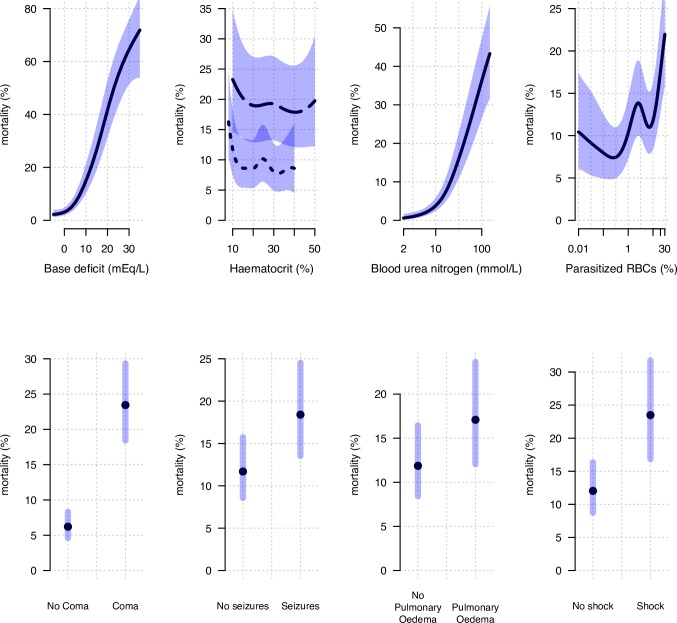
Fig 2. The unadjusted associations between in-hospital mortality from severe falciparum malaria and the eight clinical factors of interest.
For the continuous variables (top row), the thick black lines (blue shaded areas) show the mean (95% CI) values from a mixed-effects logistic generalised additive model for which the independent random-effect terms were ‘study’ and ‘country’. The generalised additive models allow nonlinear relationships between the continuous covariates and mortality. The relationship between haematocrit and death is shown separately for children (≤12 years old) by the dotted line and for adults by the dashed line. Their ranges are taken to represent the 1%–99% quantile ranges for children and adults, respectively. For the binary variables (bottom row), the black dots (blue intervals) show the mean (95% CI) for a mixed-effects logistic regression model, with the same random-effect terms. The x-axes for blood urea nitrogen and percent of parasitised RBCs are on a log10 scale. RBC, red blood cell.

