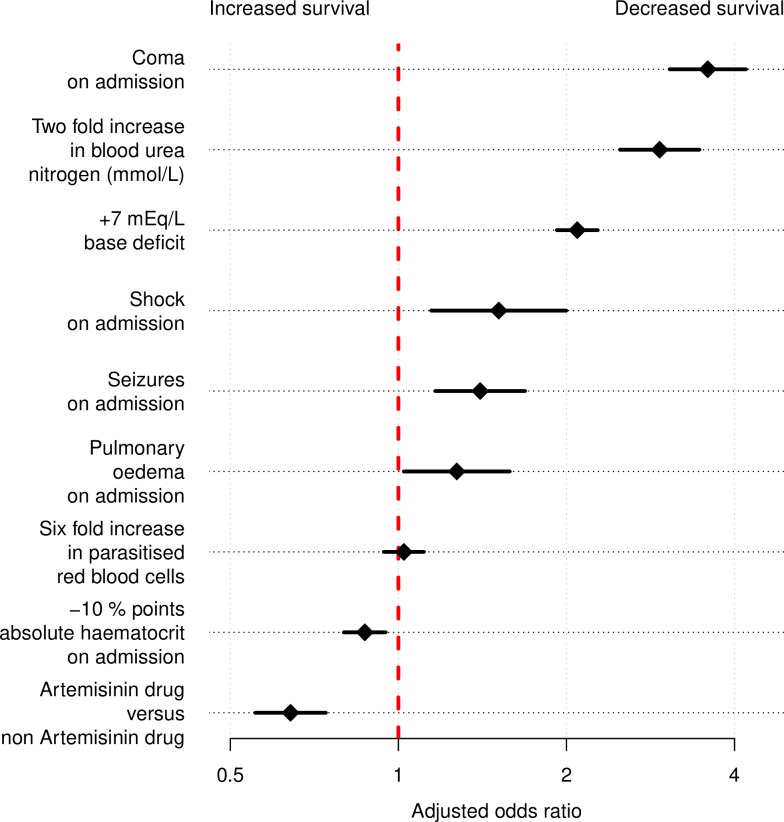
Fig 4. Estimated causal effects on mortality of main patient characteristics and treatment drug used.
Adjusted odds ratios for death are shown on the log2 scale (values greater than 1 indicate a higher risk of death) and correspond to the combined results of a logistic regression model fitted to 100 independently imputed datasets. The scale of the unit changes was chosen to be approximately equal to 1 standard deviation of the population distribution (this is on a logarithmic scale for blood urea nitrogen and percent parasitised red blood cells).

