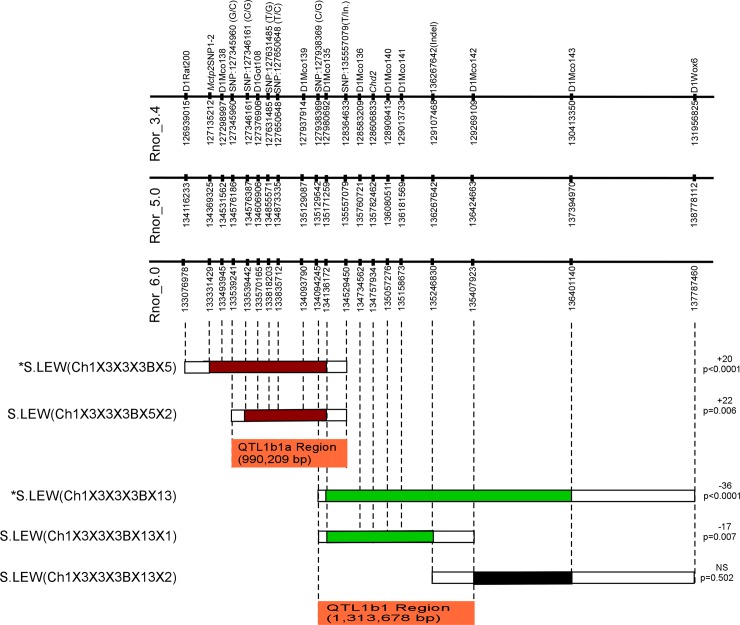
Fig 1. The schematic map of new congenic substrains.
The physical map of RNO1 is shown along with the microsatellite and SNP markers with their locations according to the Ensembl database (www.ensembl.org, RGSC 3.4, 5.0 and 6.0). The horizontal bars below the physical map represent schematics of congenic strains. Introgressed LEW segments are shown with colored bars. A red bar indicates that the congenic strain had a significantly higher BP than S. A green bar indicates that the congenic strain had a significantly lower BP compared with S. A black bar indicates that the congenic strain had no significant change in BP compared with S. The white boxes flanking each of the congenic strains are regions of recombination. The BP effect of each strain compared with S is shown to the right of the schematic of each congenic strain. The locations of the newly identified BP QTLs are indicated as orange bars. *Data from S.LEW (Ch1x3x3x3Bx5) and S.LEW (Ch1x3x3x3Bx13) was previously published and is presented here for completeness [16].

