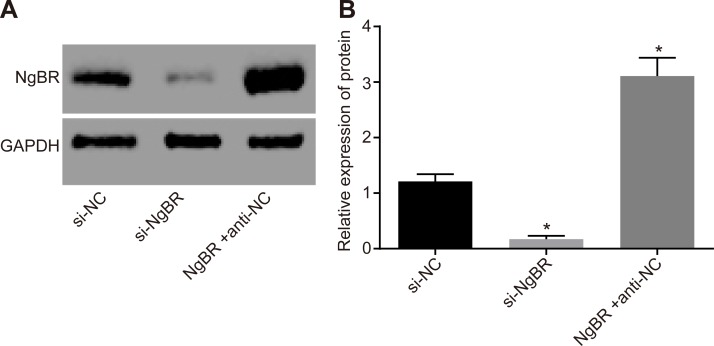
Fig 2. The results of Western blot analysis showed that NgBR overexpression plasmid increased NgBR expression.
AB, NgBR protein level by Western blot analysis showed that the si-NgBR group had a significant decrease of NgBR expression but the NgBR + anti-NC group had an obvious increase than that in the si-NC group. The statistical values were analyzed by one-way ANOVA among multiple groups, followed by Tukey’s post hoc test. * p < 0.05 vs. the si-NC group.

