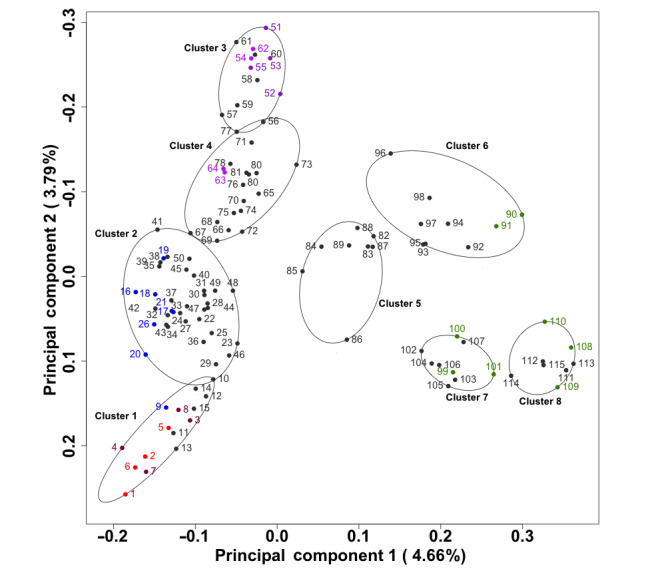
Figure 3.

Emotion clustering using both pre- and postactivity emotion endorsements. The points in the plot reflect positions in the first 2 principal components defined by the Bray-Curtis distance between each pre- and postactivity emotional selection. The 8 circular clusters encompassing the emotions were defined by a permutation around medoids analysis technique, in which 8 clusters maximized the average cluster silhouette scores. Cluster boundaries are drawn on the smallest region including all underlying emotions. Emotions are labeled by clinical association such that terms clinically associated with anger are in red and pink, depression in blue, anxiety in purple, and happiness in green.
