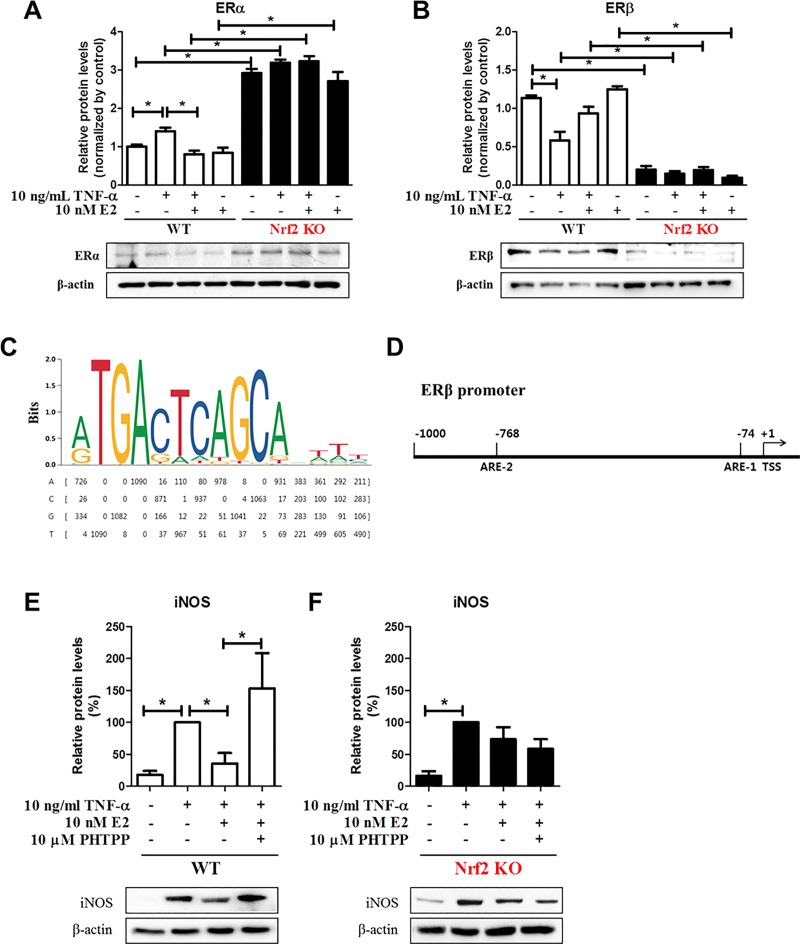
Fig 3. The protein expression of ERα and ERβ was oppositely altered in WT and Nrf2 KO MEFs.
(A-B) WT and Nrf2 KO MEFs were treated with 10 ng/mL TNF-α for 6 h in in the absence or presence of 10 nM E2 for 48 h and harvested for Western blot analysis to measure expression of ERα (A) and ERβ (B). (C) A MAF/NF-E2 complex binding motif logo (upper panel) and frequency matrix (bottom panel) from JASPAR. (D) In silico analysis of Nrf2 binding sites. Schematic representation shows two putative positions of in silico-predicted Nrf2 binding sites (AREs) in the promoter region of mouse ERβ. (E-F) WT (E) and Nrf2 KO MEFs (F) were treated with 10 ng/mL TNF-α for 6 h in the absence or presence of 10 nM E2 for 48 h. 10 μM PHTPP was treated along with E2 for 48 h and harvested for Western blot analysis to measure expression of iNOS. β-actin was used as an internal control to normalize the expression. Mean with SEM. *, p<0.05 for comparison between two groups.

