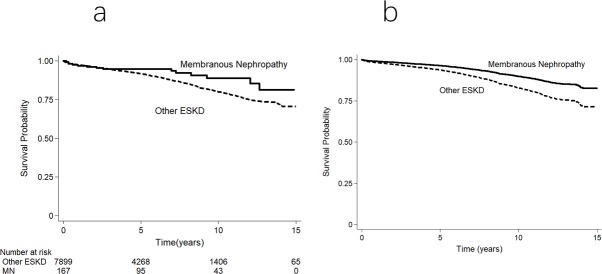
Fig 4. Transplant patient survival curves for individuals undergoing first kidney transplantation for ESKD in Australia and New Zealand.
(a) Unadjusted Kaplan–Meier survival curve. (b) Survival curve adjusted for demographic, comorbidity and allograft indices. The difference between the 2 groups was significant in the adjusted analyses (unadjusted p = 0.049; adjusted p = 0.04).

